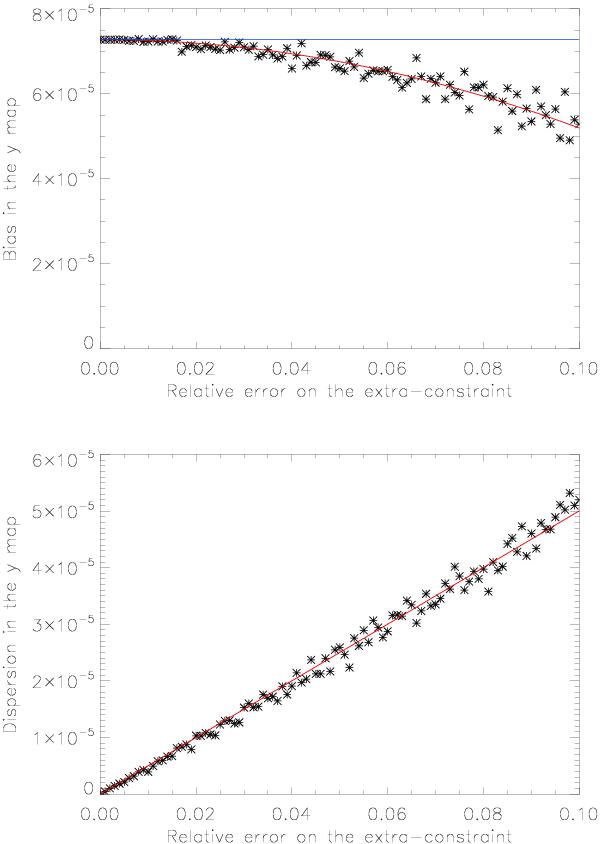
Fig. 7

Top panel: bias induced in the MILCA reconstruction when using a noisy SED as extra constraint. Black points are the mean from the 200 simulations for each value of the relative error, the red line represents the best-fit for the bias term and the blue line is the expected value in an unbiased case. Bottom panel: extra noise induced in the MILCA reconstruction when using a noisy SED as extra constraint. Black points are computed from the 200 simulation for each value of the relative error and the red line represents the best-fit for the noise term. The contamination are presented in units of Compton parameter for the central pixel of the reconstructed map for which we expect the maximum contamination.
Current usage metrics show cumulative count of Article Views (full-text article views including HTML views, PDF and ePub downloads, according to the available data) and Abstracts Views on Vision4Press platform.
Data correspond to usage on the plateform after 2015. The current usage metrics is available 48-96 hours after online publication and is updated daily on week days.
Initial download of the metrics may take a while.


