Fig. 4
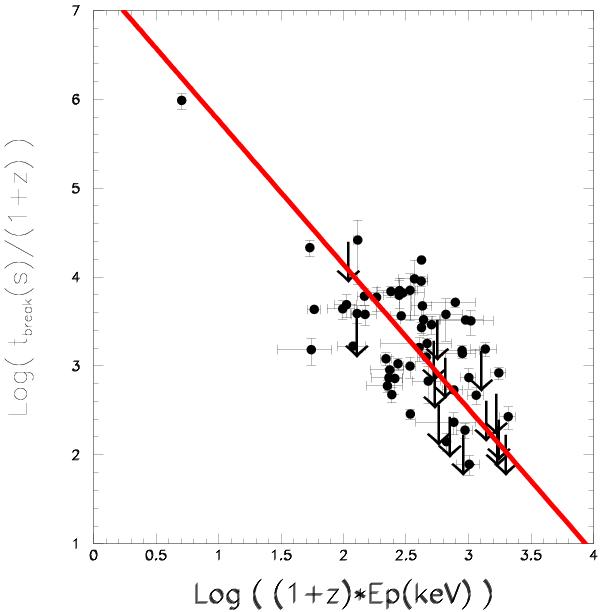
Comparison between the binary correlation  predicted
by the CB model (Eq. (7)) and that observed in 70 Swift GRBs with
known redshift,
predicted
by the CB model (Eq. (7)) and that observed in 70 Swift GRBs with
known redshift,  and
and
 . Arrows
indicate observational upper bounds on early time deceleration breaks that may have
taken place before the beginning of the Swift/XRT observations or are
hidden under the prompt emission tail.
. Arrows
indicate observational upper bounds on early time deceleration breaks that may have
taken place before the beginning of the Swift/XRT observations or are
hidden under the prompt emission tail.
Current usage metrics show cumulative count of Article Views (full-text article views including HTML views, PDF and ePub downloads, according to the available data) and Abstracts Views on Vision4Press platform.
Data correspond to usage on the plateform after 2015. The current usage metrics is available 48-96 hours after online publication and is updated daily on week days.
Initial download of the metrics may take a while.