Fig. 4
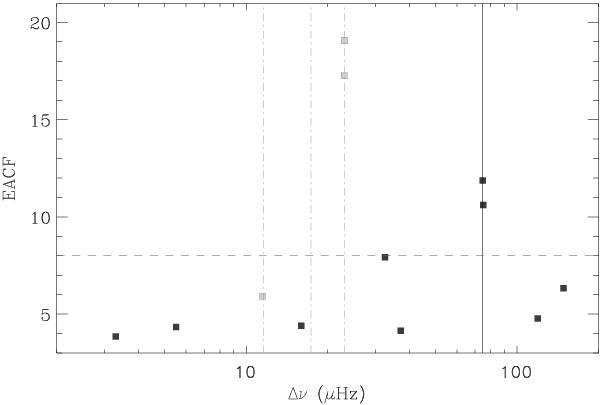
Automatic determination of the large separation. Dark squares indicate the values of EACF tested in 13 frequency ranges between 2 and 220 μHz. Gray values are artifacts cause by the CoRoT low Earth orbit and must be excluded. The horizontal dashed line indicates the threshold level for a detection at the 1% rejection level. The vertical dark gray line indicates the observed signature at Δν ≃ 75 μHz, and the dash-dotted lines the spurious signatures of the daily aliases (11.6 and 23.2 μHz).
Current usage metrics show cumulative count of Article Views (full-text article views including HTML views, PDF and ePub downloads, according to the available data) and Abstracts Views on Vision4Press platform.
Data correspond to usage on the plateform after 2015. The current usage metrics is available 48-96 hours after online publication and is updated daily on week days.
Initial download of the metrics may take a while.