Fig. 2
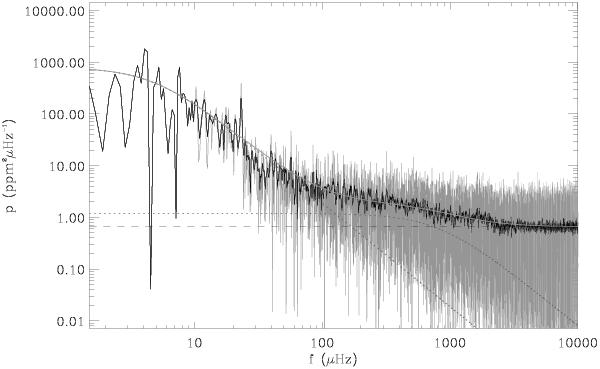
Power density spectrum in log-scale axes. The peak around 4 μHz is probably the signature of the stellar rotation; the peak at 23.2 μHz is an artifact due to the low-Earth orbit. The black curve corresponds to a box-car-averaged spectrum, with a varying smoothing window (the size of the window increases linearly with frequency). The dashed line represents the white-noise component; the background is modeled with two Harvey-like components indicated by the dotted lines.
Current usage metrics show cumulative count of Article Views (full-text article views including HTML views, PDF and ePub downloads, according to the available data) and Abstracts Views on Vision4Press platform.
Data correspond to usage on the plateform after 2015. The current usage metrics is available 48-96 hours after online publication and is updated daily on week days.
Initial download of the metrics may take a while.