Fig. 16
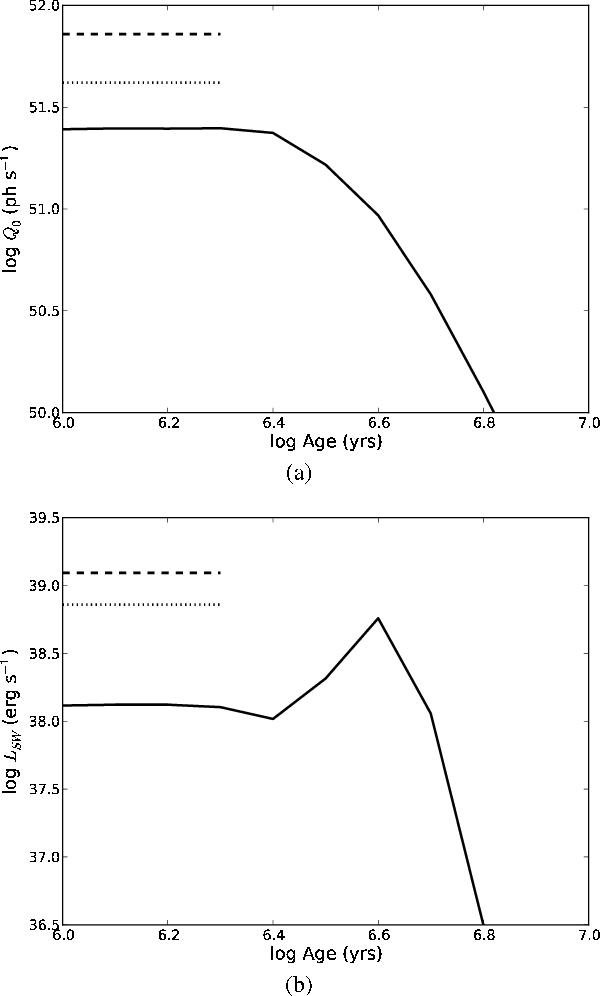
Integrated ionising luminosity a) and stellar wind luminosity b) of the R136 region. Predictions from Starburst99 are plotted with a solid line. Values from our census, with and without Minit > 100 M⊙ stars, are plotted in dashed and dotted lines, respectively.
Current usage metrics show cumulative count of Article Views (full-text article views including HTML views, PDF and ePub downloads, according to the available data) and Abstracts Views on Vision4Press platform.
Data correspond to usage on the plateform after 2015. The current usage metrics is available 48-96 hours after online publication and is updated daily on week days.
Initial download of the metrics may take a while.