Fig. 1
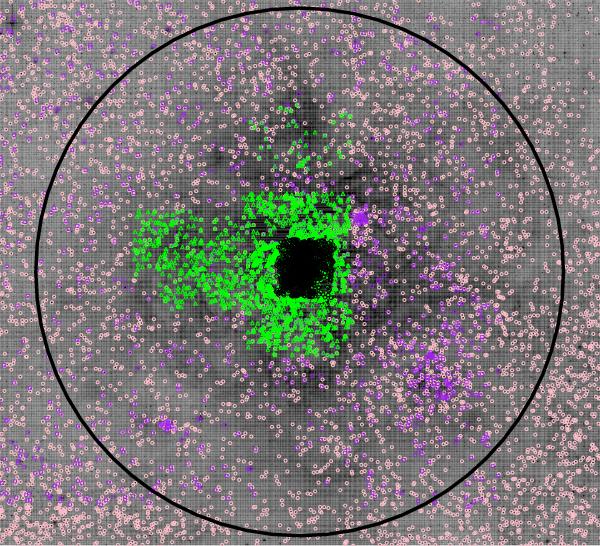
Spatial coverage of photometric sources from the four main catalogues used in the census, overlaid on a V-band WFI image. Selman (black circles), WFI (pink circles), Parker (green triangles) and CTIO (purple squares). The large black circle marks the rd = 10 arcmin region of the census. North is up and east is to the left.
Current usage metrics show cumulative count of Article Views (full-text article views including HTML views, PDF and ePub downloads, according to the available data) and Abstracts Views on Vision4Press platform.
Data correspond to usage on the plateform after 2015. The current usage metrics is available 48-96 hours after online publication and is updated daily on week days.
Initial download of the metrics may take a while.