Fig. 8
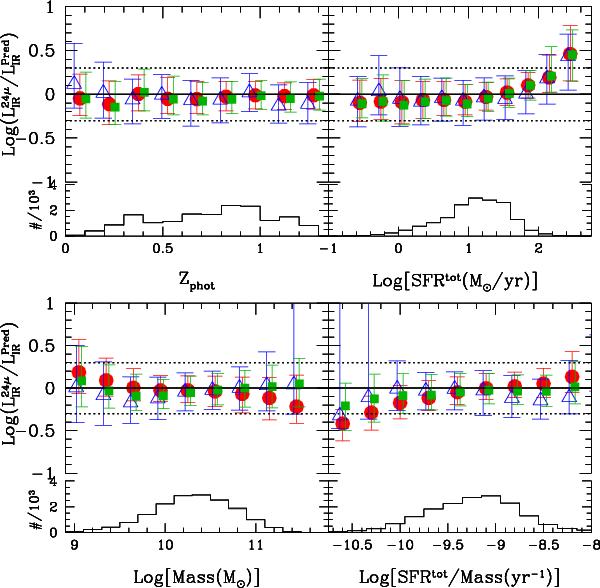
Median and dispersion of the difference (i.e., residuals) between the IR luminosity based on the 24 μm flux (i.e.,  ) and that predicted with different methods, as a function of different galaxy physical parameters. In each panel red-filled circles refer to the NRK method, green squares to the NRK sSFR-corrected and open-blue triangles to the SED fitting (open-blue triangles). Top-left panel shows the residuals as function of redshift, top-right of total SFR, bottom-left of stellar mass and bottom-right of specific SFR. The number distribution for each physical parameter is shown as an histogram in the lower part of each panel.
Current usage metrics show cumulative count of Article Views (full-text article views including HTML views, PDF and ePub downloads, according to the available data) and Abstracts Views on Vision4Press platform.
Data correspond to usage on the plateform after 2015. The current usage metrics is available 48-96 hours after online publication and is updated daily on week days.
Initial download of the metrics may take a while.