Fig. 5
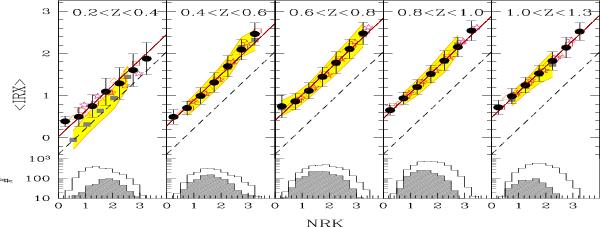
Volume weighted mean IRX (⟨IRX⟩, on a logarithmic scale) as a function of NRK in five redshift bins. The COSMOS sample based on photometric redshifts is shown as solid black circles. gray squares and yellow shaded area indicate the mean IRX and dispersion for the spectroscopic sample of local galaxies of Johnson et al. (2007a) (left-most panel) and the COSMOS spectroscopic sample (four right-most panels). The solid red line indicates the predictions of Eq. (3)for ⟨IRX⟩ as a function of NRK at the mean redshift of the bin, while the dashed line refers to  the mean redshift of the Johnson et al. (2007a) sample. We overplot the different mass selected samples: 9.5 ≤ log (M/M⊙) ≤ 10.0 (open triangles); 10.0 ≤ log (M/M⊙) ≤ 10.5 (open squares); 10.5 ≤ log (M/M⊙) ≤ 11.5 (open stars). The distributions of NRK for the total (solid lines) and spectroscopic samples (shaded histograms) are shown in the bottom part of each panel.
Current usage metrics show cumulative count of Article Views (full-text article views including HTML views, PDF and ePub downloads, according to the available data) and Abstracts Views on Vision4Press platform.
Data correspond to usage on the plateform after 2015. The current usage metrics is available 48-96 hours after online publication and is updated daily on week days.
Initial download of the metrics may take a while.