Fig. 4
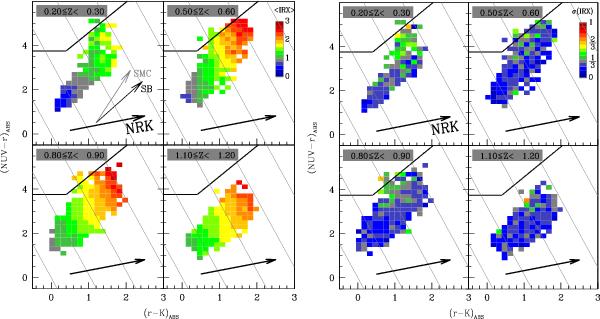
Infrared excess (IRX) in the (NUV − r) versus (r − K) diagram. Left figure: volume-weighted mean IRX (⟨IRX⟩) for the 24 μm-selected sources in 4 redshift bins, color coded in a logarithmic scale (shown in the top right panel). We overplot in the top-left panel the attenuation vectors for starburst and SMC attenuation curves assuming E(B − V) = 0.4. In each panel, we overplot the vector NRK (black arrows) and its perpendicular lines (gray solid lines) corresponding to NRK in the range 0 to 4. (note the different dynamic ranges in x and y-axis warping the angles). Right figure: dispersion around the mean (σ(IRX)), color coded in a logarithmic scale.
Current usage metrics show cumulative count of Article Views (full-text article views including HTML views, PDF and ePub downloads, according to the available data) and Abstracts Views on Vision4Press platform.
Data correspond to usage on the plateform after 2015. The current usage metrics is available 48-96 hours after online publication and is updated daily on week days.
Initial download of the metrics may take a while.