Fig. 12
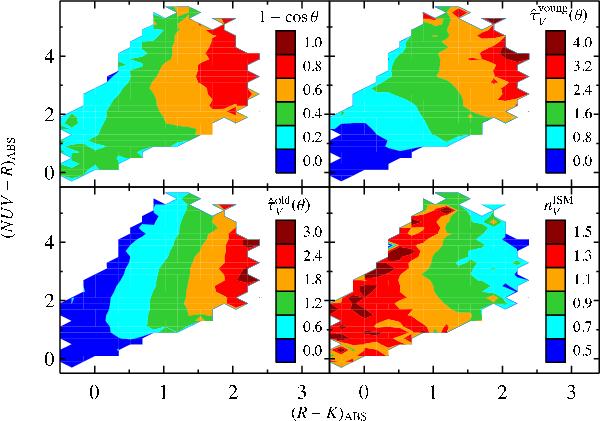
Mean value in bins of constant (NUV − r) and (r − K) of different parameters describing attenuation of starlight from dust for the model SEDs described in Sect. 5. Top-left panel: galaxy inclination 1 − cosθ. Top-right panel, V-band attenuation optical depth suffered by stars younger than 107 yr  . Bottom-left panel, V-band attenuation optical depth suffered by stars older than 107 yr
  . Bottom-right panel, slope of the optical attenuation curve in the diffuse ISM,
  , measured from a power law fit to the model attenuation curves in the range 0.4 ≤ λ ≤ 0.7 μm.
Current usage metrics show cumulative count of Article Views (full-text article views including HTML views, PDF and ePub downloads, according to the available data) and Abstracts Views on Vision4Press platform.
Data correspond to usage on the plateform after 2015. The current usage metrics is available 48-96 hours after online publication and is updated daily on week days.
Initial download of the metrics may take a while.