Fig. 11
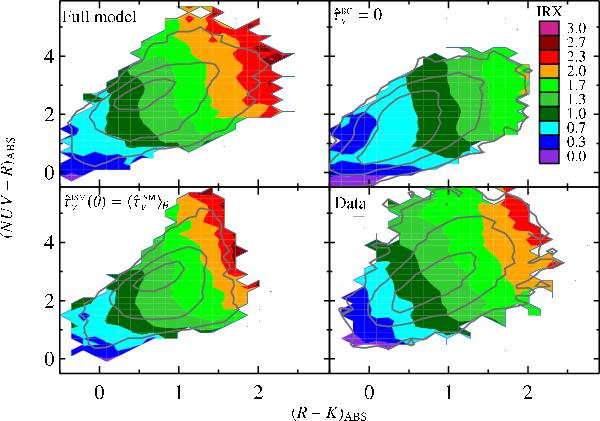
Values of ⟨IRX⟩ (color coded on a logarithmic scale) in the NUVrK diagram. The solid gray lines in each panel indicate the number density contour of the galaxies corresponding to 0.01, 0.1 and 0.5 the maximum density. Top-left panel, 20 000 model SEDs computed with the “full model” (see Sect. 5). This includes the dust prescription of Chevallard et al. (2013), which accounts for the effect on dust attenuation of galaxy geometry, inclination and enhanced attenuation of young stars by their birth clouds. Top-right panel, same as top-left panel, but neglecting the enhanced attenuation of young stars, i.e., fixing the birth clouds optical depth  . Bottom-left panel, same as top-left panel, but neglecting the effect of galaxy inclination, i.e., adopting the angle-averaged attenuation curves
  . Bottom-right panel, data (see Sect. 3 and Fig. 4).
Current usage metrics show cumulative count of Article Views (full-text article views including HTML views, PDF and ePub downloads, according to the available data) and Abstracts Views on Vision4Press platform.
Data correspond to usage on the plateform after 2015. The current usage metrics is available 48-96 hours after online publication and is updated daily on week days.
Initial download of the metrics may take a while.