Free Access
Fig. 9
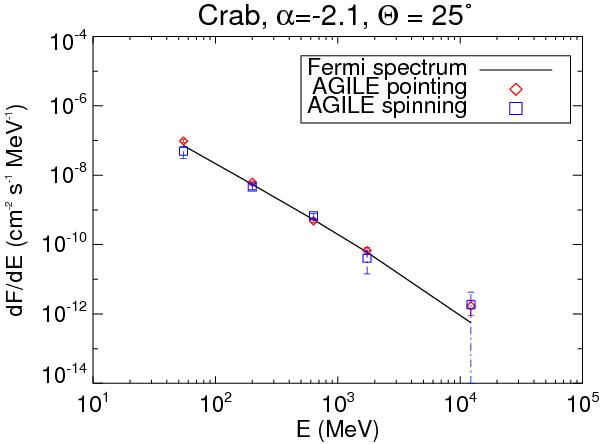
Fluxes of the source at the position of the Crab pulsar found using the new effective area calculation (I0023) and the new PSF (I0023) for long integrations in pointing (red diamonds) and spinning (blue squares) mode. The black curve represents the flux and spectrum listed in 1FGL. No curve fitting was performed.
Current usage metrics show cumulative count of Article Views (full-text article views including HTML views, PDF and ePub downloads, according to the available data) and Abstracts Views on Vision4Press platform.
Data correspond to usage on the plateform after 2015. The current usage metrics is available 48-96 hours after online publication and is updated daily on week days.
Initial download of the metrics may take a while.