Fig. 2
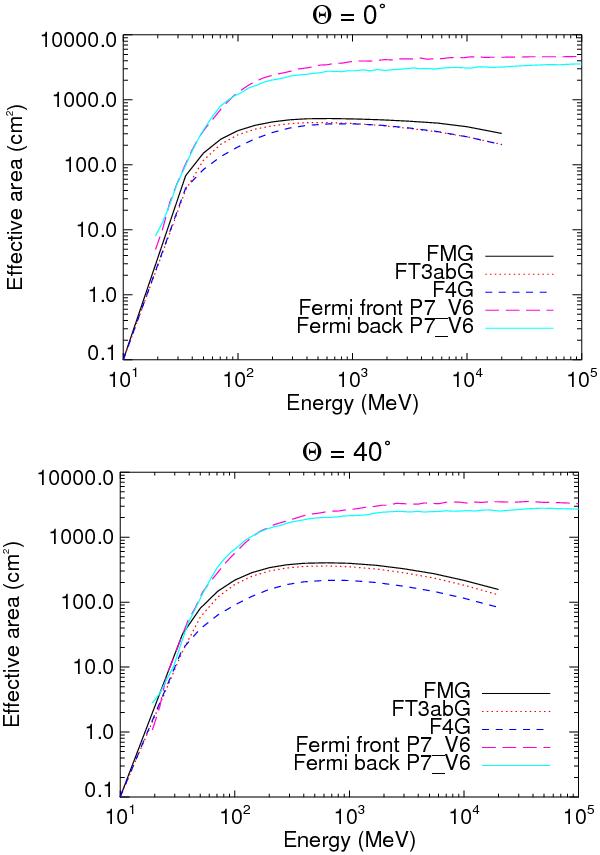
AGILE and Fermi effective areas as a function of energy. The top plot is for Θ = 0°, the bottom plot for Θ = 40°. AGILE curves are for filters FT3ab and FM3.119, event class G. Fermi Pass 7 curves are for version 6, SOURCE event class, front and back events. Fermi IRFs are taken from the Fermi Science Tools, version v9r23p1. The current version is available for public download at http://fermi.gsfc.nasa.gov/ssc/data/analysis/software/.
Current usage metrics show cumulative count of Article Views (full-text article views including HTML views, PDF and ePub downloads, according to the available data) and Abstracts Views on Vision4Press platform.
Data correspond to usage on the plateform after 2015. The current usage metrics is available 48-96 hours after online publication and is updated daily on week days.
Initial download of the metrics may take a while.