Fig. 9
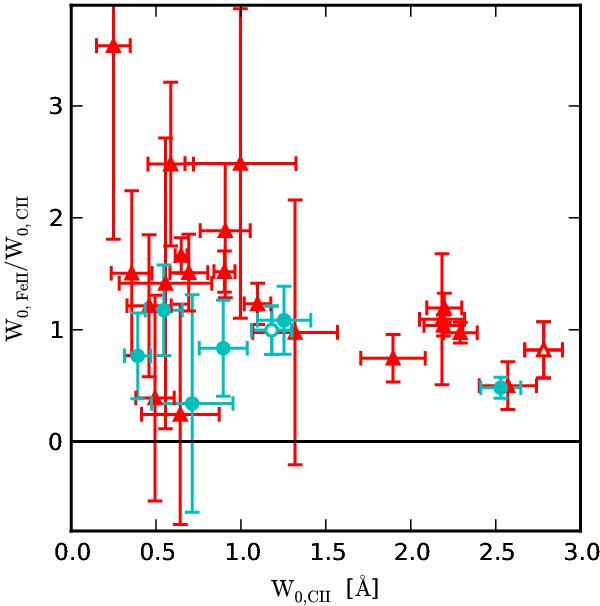
Equivalent width ratio W0, Fe ii/W0, C ii, is plotted as a function of W0, C ii. DLAs where narrow Lyα emission is detected are marked by blue circles, and DLAs without a 4-σ detection are marked by red triangles. Filled symbols indicate that W0 is measured from the fit to the absorption line, and empty symbols indicate that W0 is estimated from the flux. One spectrum has flux problems at the location of the C ii – 1334 Å absorption, and Fe ii – 2344 Å is redshifted out of the spectrum in two cases. Twenty-nine of the 31 DLAs in the statistical sample are plotted here, 7 with an emission detection and 22 without.
Current usage metrics show cumulative count of Article Views (full-text article views including HTML views, PDF and ePub downloads, according to the available data) and Abstracts Views on Vision4Press platform.
Data correspond to usage on the plateform after 2015. The current usage metrics is available 48-96 hours after online publication and is updated daily on week days.
Initial download of the metrics may take a while.