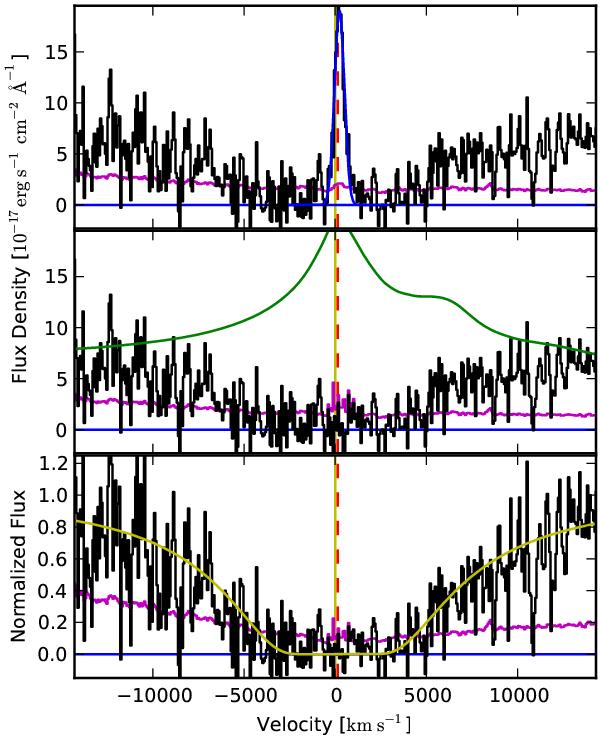
Fig. 3
Top: Gaussian fit (blue) to the narrow Lyα emission revealed by the associated DLA toward SDSS J1256+3506. Center: the narrow Lyα emission is subtracted, and a quasar continuum template (green) is fitted to the spectrum. Bottom: the spectrum is normalized and the H i column density is fitted (yellow). SDSS J1256+3506 has log N(H i) = 22.1. The dashed red line marks the DLA redshift, and the solid vertical yellow line indicates the velocity offset for the quasar.
Current usage metrics show cumulative count of Article Views (full-text article views including HTML views, PDF and ePub downloads, according to the available data) and Abstracts Views on Vision4Press platform.
Data correspond to usage on the plateform after 2015. The current usage metrics is available 48-96 hours after online publication and is updated daily on week days.
Initial download of the metrics may take a while.