Fig. 18
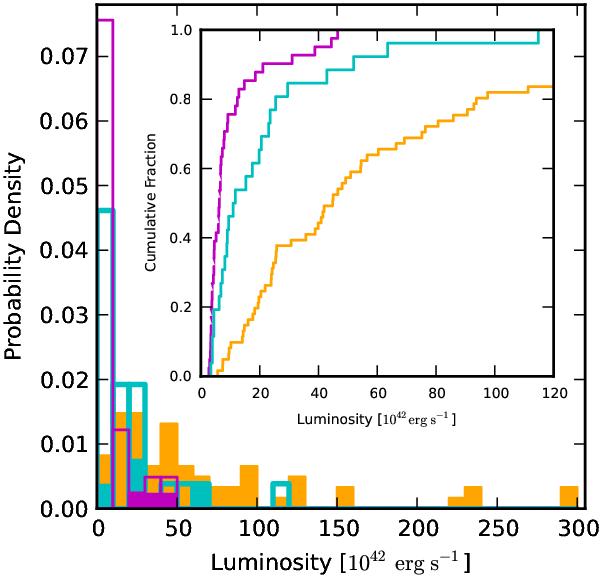
Distribution of Lyα emission luminosities for our sample (thick cyan), LAEs (magenta), and radio galaxies (filled yellow). Cross-hatched magenta shading denotes LAEs that have an AGN contribution (3). Cyan shading indicates quasars in our sample that are also radio-loud (4). The inset shows the K-S test cumulative fraction out to 120 × 1042 erg s-1 with the same color scheme. The cumulative fraction distribution is scaled for a comparison between our sample and LAEs and is truncated for the radio galaxies.
Current usage metrics show cumulative count of Article Views (full-text article views including HTML views, PDF and ePub downloads, according to the available data) and Abstracts Views on Vision4Press platform.
Data correspond to usage on the plateform after 2015. The current usage metrics is available 48-96 hours after online publication and is updated daily on week days.
Initial download of the metrics may take a while.