Fig. 10
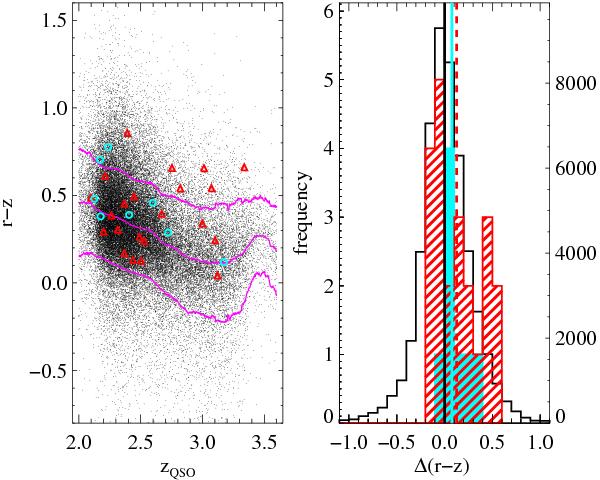
r − z color as a function of the quasar redshift (left) and the r − z color distribution (right) for DR9 quasars without BALs or a DLA along the line-of-sight (black), associated DLAs without an emission detection (red), and associated DLAs with narrow Lyα emission detected (cyan). In the color plot, the median and 1-σ colors for the DR9 quasar sample are shown as magenta curves.
Current usage metrics show cumulative count of Article Views (full-text article views including HTML views, PDF and ePub downloads, according to the available data) and Abstracts Views on Vision4Press platform.
Data correspond to usage on the plateform after 2015. The current usage metrics is available 48-96 hours after online publication and is updated daily on week days.
Initial download of the metrics may take a while.