Fig. 7
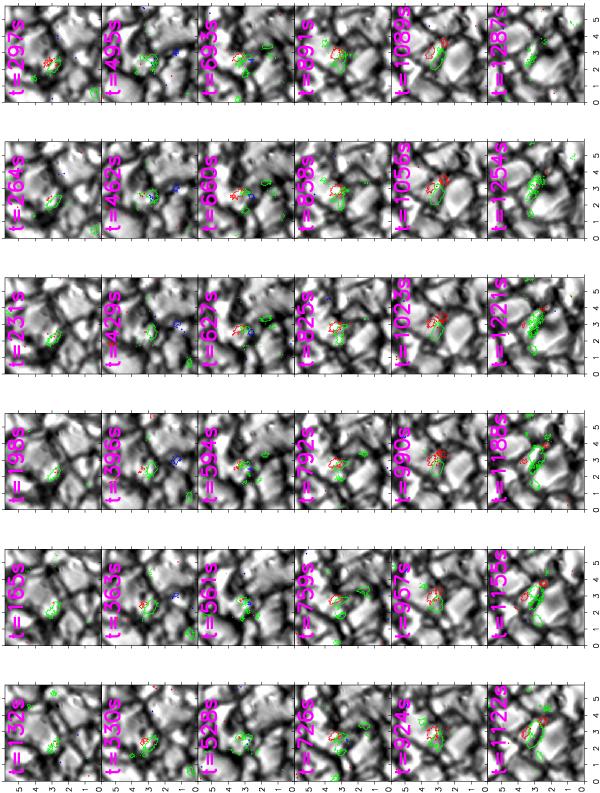
Evolution of the most complex Vc jet observed with IMaX/SUNRISE. The images correspond to the continuum intensity. Linear polarization is represented by green contours over the granular pattern. Blue and red contours correspond to positive and negative Vc signals. Time (given in each frame) runs from left to right, starting at the top (as seen by turning the page on its side). Units given with the maps are in arcsec.
Current usage metrics show cumulative count of Article Views (full-text article views including HTML views, PDF and ePub downloads, according to the available data) and Abstracts Views on Vision4Press platform.
Data correspond to usage on the plateform after 2015. The current usage metrics is available 48-96 hours after online publication and is updated daily on week days.
Initial download of the metrics may take a while.