Fig. 3
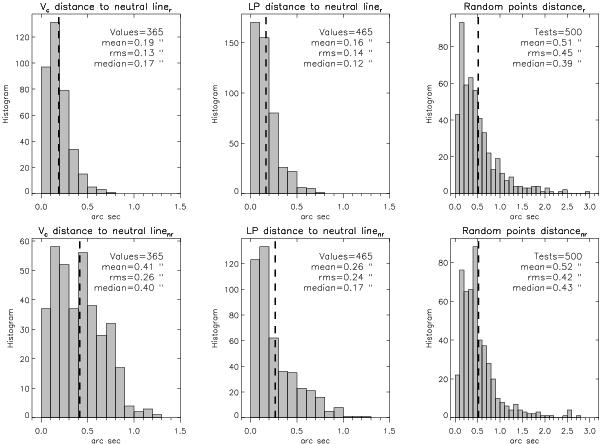
Histograms of distances between various features and neutral lines. The first column shows the distances between the centers of the non-restored Vc jets to the neutral lines defined on the restored (top) and on the non-restored magnetogram (bottom). The second column shows the same quantity for the linear polarization patches. The third column presents the distances of randomly distributed points to their nearest neutral lines.
Current usage metrics show cumulative count of Article Views (full-text article views including HTML views, PDF and ePub downloads, according to the available data) and Abstracts Views on Vision4Press platform.
Data correspond to usage on the plateform after 2015. The current usage metrics is available 48-96 hours after online publication and is updated daily on week days.
Initial download of the metrics may take a while.