Fig. 7
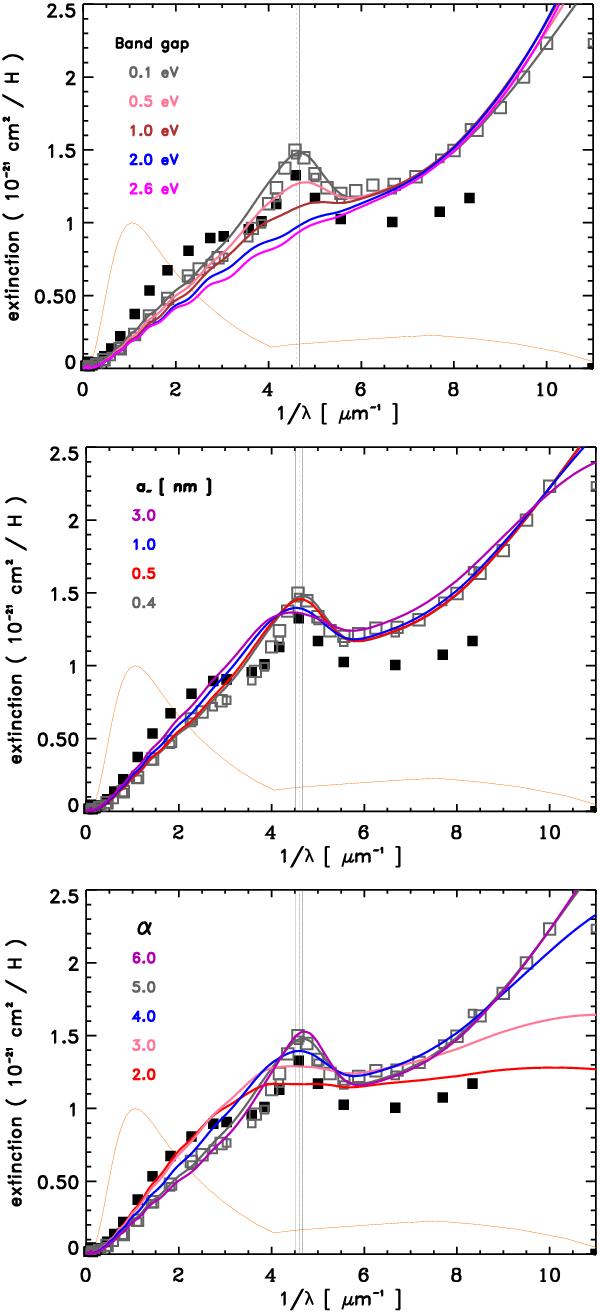
Dust model extinction for fixed dust mass as a function of Eg (top), a− (middle) and α (bottom). The solid (dotted) vertical grey lines mark the model (observed) UV bump peak positions. The symbols indicate the observed extinction for RV = 3.1 (grey open squares) and 5.1 (black filled squares) (Savage & Mathis 1979; Mathis 1990). The orange line shows the intensity of the adopted ISRF plotted as Jλ/λ and normalised to unity.
Current usage metrics show cumulative count of Article Views (full-text article views including HTML views, PDF and ePub downloads, according to the available data) and Abstracts Views on Vision4Press platform.
Data correspond to usage on the plateform after 2015. The current usage metrics is available 48-96 hours after online publication and is updated daily on week days.
Initial download of the metrics may take a while.