Fig. 15
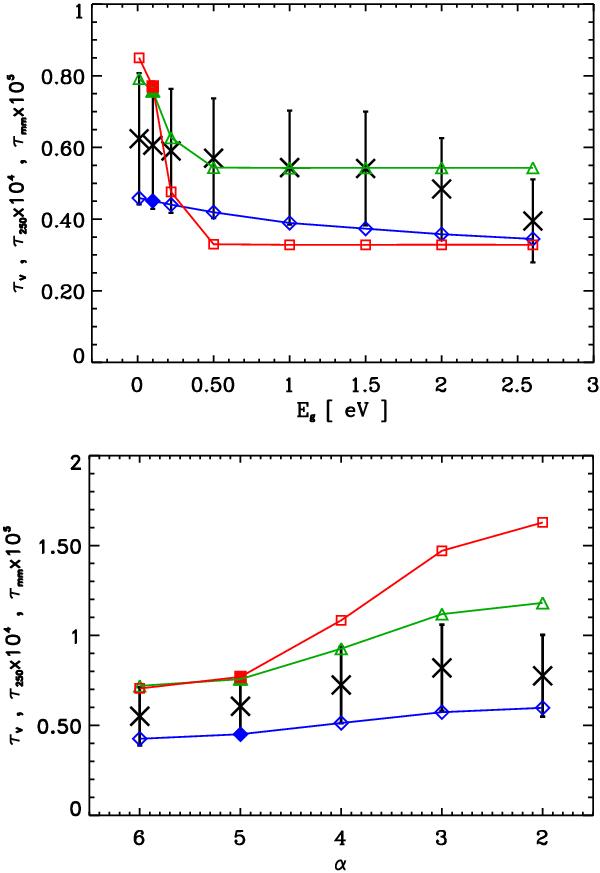
Dust model extinction, τi, in the V band (blue) and at 250 μm (green) and 1 mm (red) wavelengths for an assumed column density NH = 1021 H cm-2. The upper plot shows the variations as a function of the a-C(:H) material band gap, Eg, and the lower plot as a function of the power-law, α, component of the small a-C dust population. The filled data points indicate the values for the best-fit DHGL dust model. The crosses with error bars show τ250 = 5.8 ± 1.7 × 10⁻⁴ E(B − V), from Eq. (2), multiplied by 104.
Current usage metrics show cumulative count of Article Views (full-text article views including HTML views, PDF and ePub downloads, according to the available data) and Abstracts Views on Vision4Press platform.
Data correspond to usage on the plateform after 2015. The current usage metrics is available 48-96 hours after online publication and is updated daily on week days.
Initial download of the metrics may take a while.