Fig. 14
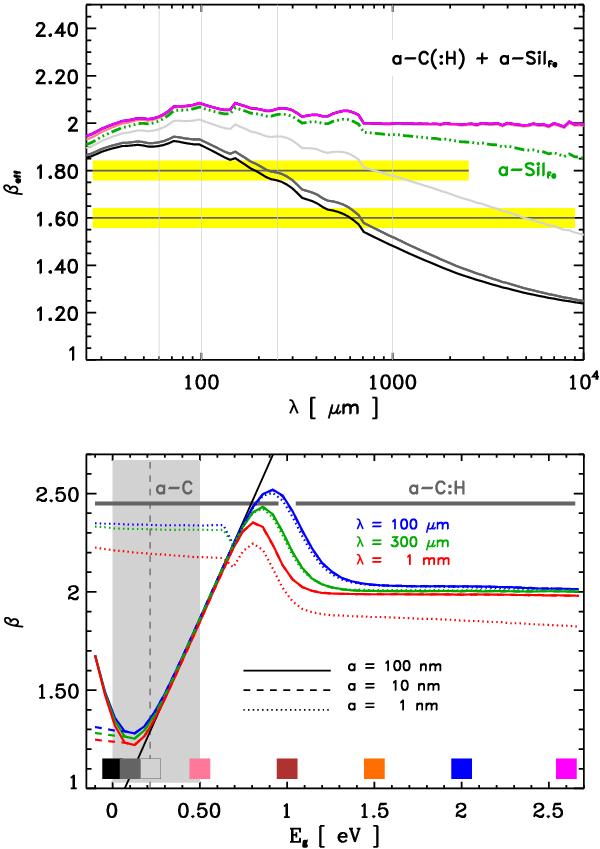
Upper plot: βeff vs. λ, as a function of Eg, where βeff is the effective emissivity slope resulting from a combination of the a-SilFe/a-C and a-C:H/a-C dust population optical properties. The green triple dot-dashed line shows the data for only the a-SilFe/a-C grains, which do not depend on the band gap of the thin a-C(:H) coating. The λ-dependence and variations are therefore only due to the a-C(:H) dust properties. The line colour-coding is as per Fig. 11. The horizontal grey lines and wide yellow bands show βeff = 1.80 ± 0.05 and 1.60 ± 0.05. Lower plot: the emissivity slope, β, for a-C(:H) dust, for λ = 100 μm, 300 μm, and 1 mm, as a function of Eg, for a = 100, 10 and 1 nm. The vertical grey dashed line shows the experimentally-derived “block” on band gap evolution (see Paper II). The grey area indicates the range of a-C materials that are consistent with many diffuse ISM dust properties (Sect. 6). The coloured squares at the bottom indicate the band gap colour coding scheme.
Current usage metrics show cumulative count of Article Views (full-text article views including HTML views, PDF and ePub downloads, according to the available data) and Abstracts Views on Vision4Press platform.
Data correspond to usage on the plateform after 2015. The current usage metrics is available 48-96 hours after online publication and is updated daily on week days.
Initial download of the metrics may take a while.