Free Access
Fig. 13
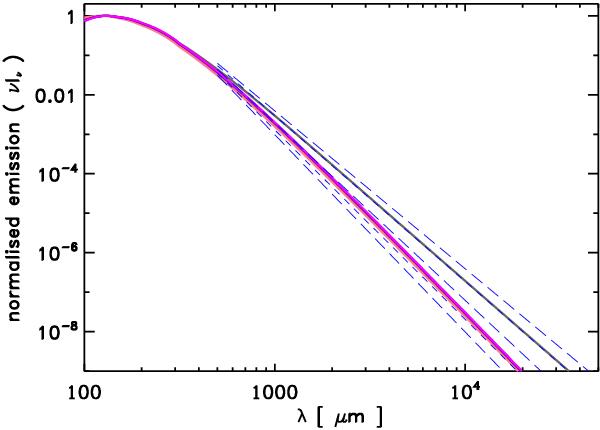
Normalised FIR-cm SEDs show that the emissivity slopes segregate into two band-gap groups, one with β ~ 1.3 for Eg ~ 0 eV and the other with β ~ 2 for Eg ≳ 0.5 eV. The line designations are as per Fig. 7. The dashed blue lines indicate slopes of −1.0, −1.3, −1.5, −1.8 and − 2.0, from top to bottom.
Current usage metrics show cumulative count of Article Views (full-text article views including HTML views, PDF and ePub downloads, according to the available data) and Abstracts Views on Vision4Press platform.
Data correspond to usage on the plateform after 2015. The current usage metrics is available 48-96 hours after online publication and is updated daily on week days.
Initial download of the metrics may take a while.