Fig. 10
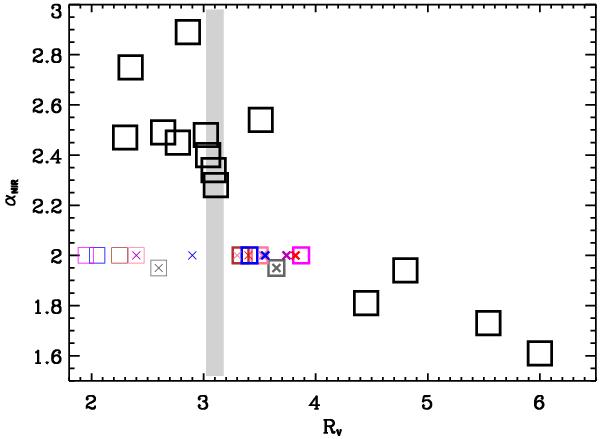
Fitzpatrick & Massa (2009) NIR extinction parameter αNIR as a function of RV (large black squares), see Eq. (1). The fit parameters for our model as a function of Eg (α) are shown by the coloured squares (crosses), the colour-coding as per Fig. 7. The thick squares use the model RV and the thin squares the best fit RV values from Eq. (1), shown as the dashed lines in Fig. 9. The vertical grey band shows the typical diffuse ISM value of RV.
Current usage metrics show cumulative count of Article Views (full-text article views including HTML views, PDF and ePub downloads, according to the available data) and Abstracts Views on Vision4Press platform.
Data correspond to usage on the plateform after 2015. The current usage metrics is available 48-96 hours after online publication and is updated daily on week days.
Initial download of the metrics may take a while.