Fig. 8
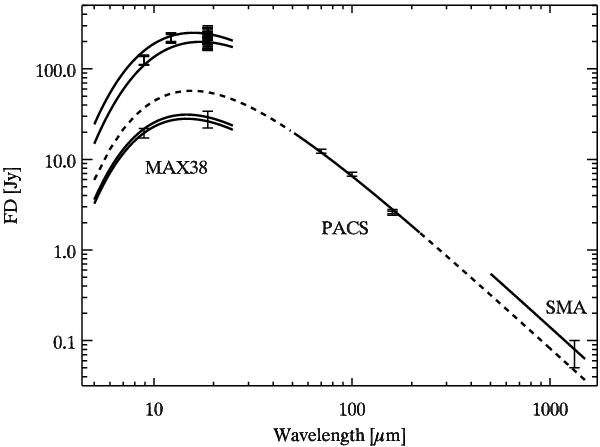
Observered and calibrated flux densities together with the corresponding TPM prediction. The model predictions for the MAX38 data are shown at the start and end time of each observing day. The distance between observer and target and also the phase angle changed rapidly during the close encounter period of three days. For the PACS data the model prediction from 5 to 1500 μm is shown.
Current usage metrics show cumulative count of Article Views (full-text article views including HTML views, PDF and ePub downloads, according to the available data) and Abstracts Views on Vision4Press platform.
Data correspond to usage on the plateform after 2015. The current usage metrics is available 48-96 hours after online publication and is updated daily on week days.
Initial download of the metrics may take a while.