Fig. 13
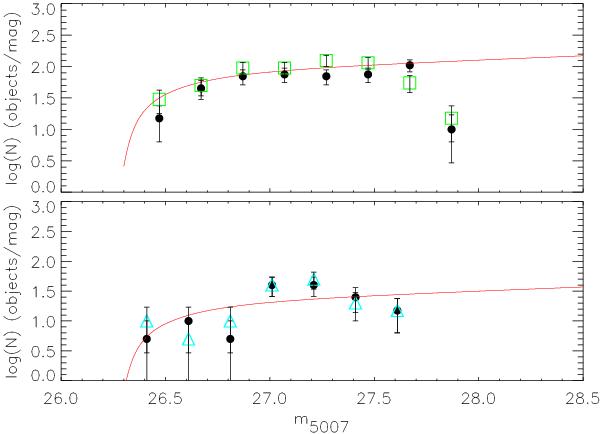
Luminosity functions of the matched PN samples from this survey (filled circles), from C98 (top panel, green squares), and from F03 (bottom panel, cyan triangles). The error bars show the 1σ uncertainty from counting statistics. Data are binned into 0.2 mag intervals. The solid red line represents the analytical PNLF model using a distance modulus of 30.8, convolved with photometric errors. The magnitude range is driven by the magnitude limit of the C98 sample (top panel) and F03 sample (bottom panel). A zero point shift Δ = 0.3 mag relative to our sample was applied to both survey.
Current usage metrics show cumulative count of Article Views (full-text article views including HTML views, PDF and ePub downloads, according to the available data) and Abstracts Views on Vision4Press platform.
Data correspond to usage on the plateform after 2015. The current usage metrics is available 48-96 hours after online publication and is updated daily on week days.
Initial download of the metrics may take a while.