| Issue |
A&A
Volume 558, October 2013
|
|
|---|---|---|
| Article Number | A19 | |
| Number of page(s) | 13 | |
| Section | Extragalactic astronomy | |
| DOI | https://doi.org/10.1051/0004-6361/201321622 | |
| Published online | 27 September 2013 | |
Mass entrainment and turbulence-driven acceleration of ultra-high energy cosmic rays in Centaurus A
1 Department of Astrophysics/IMAPP, Radboud University Nijmegen, PO Box 9010, 6500 GL, Nijmegen, The Netherlands
e-mail: This email address is being protected from spambots. You need JavaScript enabled to view it.
2 Astronomical Institute “Anton Pannekoek”, University of Amsterdam, PO Box 94249, 1090 GE Amsterdam, The Netherlands
3 School of Physics and Astronomy, University of Southampton, University Road, Southampton, Hampshire SO17 1BJ, UK
4 School of Physics, Astronomy and Mathematics, University of Hertfordshire, College Lane, Hatfield, Hertfordshire AL10 9AB, UK
5 National Radio Astronomy Observatory, Socorro NM 87801, USA
6 Physics Department, New Mexico Tech, Socorro NM 87801, USA
7 Max-Planck-Institut für Radioastronomie, Auf dem Hügel 69, 53121 Bonn, Germany
8 Institute for Nuclear Physics, Karlsruhe Institute of Technology, PO Box 3640, 76021 Karlsruhe, Germany
9 Department of Physics and Astronomy, University of Alabama, Tuscaloosa, AL 35487, USA
10 Department of Physics, University of Alabama at Huntsville, Huntsville, AL 35899, USA
11 School of Chemistry & Physics, University of Adelaide, SA 5005, Australia
12 CSIRO Australia Telescope National Facility, PO Box 76, Epping NSW 1710, Australia
13 Department of Astronomy, University of Wisconsin, 475 North Charter Street, Madison, WI 53706, USA
14 Sterrewacht Leiden, Leiden University, PO Box 9513, 2300 RA Leiden, The Netherlands
15 Racah Institute of Physics, The Hebrew University, 91904 Jerusalem, Israel
Received: 1 April 2013
Accepted: 1 August 2013
Abstract
Observations of the FR I radio galaxy Centaurus A in radio, X-ray, and gamma-ray bands provide evidence for lepton acceleration up to several TeV and clues about hadron acceleration to tens of EeV. Synthesising the available observational constraints on the physical conditions and particle content in the jets, inner lobes and giant lobes of Centaurus A, we aim to evaluate its feasibility as an ultra-high-energy cosmic-ray source. We apply several methods of determining jet power and affirm the consistency of various power estimates of ~1 × 1043 erg s-1. Employing scaling relations based on previous results for 3C 31, we estimate particle number densities in the jets, encompassing available radio through X-ray observations. Our model is compatible with the jets ingesting ~3 × 10²¹ g s-1 of matter via external entrainment from hot gas and ~7 × 10²² g s-1 via internal entrainment from jet-contained stars. This leads to an imbalance between the internal lobe pressure available from radiating particles and magnetic field, and our derived external pressure. Based on knowledge of the external environments of other FR I sources, we estimate the thermal pressure in the giant lobes as 1.5 × 10⁻¹² dyn cm-2, from which we deduce a lower limit to the temperature of ~1.6 × 10⁸ K. Using dynamical and buoyancy arguments, we infer ~440−645 Myr and ~560 Myr as the sound-crossing and buoyancy ages of the giant lobes respectively, inconsistent with their spectral ages. We re-investigate the feasibility of particle acceleration via stochastic processes in the lobes, placing new constraints on the energetics and on turbulent input to the lobes. The same “very hot” temperatures that allow self-consistency between the entrainment calculations and the missing pressure also allow stochastic UHECR acceleration models to work.
Key words: acceleration of particles / cosmic rays / galaxies: active / galaxies: individual: Centaurus A / galaxies: jets / turbulence
© ESO, 2013
1. Introduction
Relativistic jets and giant lobes of radio galaxies are potential sources of ultra-high energy cosmic rays (UHECRs) and very-high energy (VHE) neutrinos (e.g. Cavallo 1978; Biermann & Strittmatter 1987; Stecker et al. 1991; Mannheim 1995; Benford & Protheroe 2008; Hardcastle et al. 2009; Kachelrieß et al. 2009; Hardcastle 2010; Pe’er & Loeb 2012). The synchrotron and inverse-Compton emission from these structures is seen in all wavebands from low-frequency radio to TeV gamma-ray. Knowledge of the physical conditions in jets and giant lobes is vital for understanding high-energy particle acceleration in full. Such conditions include the mean magnetic field strength and some estimate of its spatial variation, and the plasma densities both thermal and non-thermal.
Results from the Pierre Auger Observatory (PAO) indicate that the UHECR composition changes as a function of energy (Pierre Auger Collaboration 2011b, 2013) and that a number of the detected UHECRs could originate in the radio galaxy Centaurus A (Pierre Auger Collaboration 2010b). Centaurus A (Cen A) is the nearest (3.8 ± 0.1 Mpc; Harris et al. 2010) radio galaxy, a Fanaroff-Riley class I (FR I) object (Fanaroff & Riley 1974), associated with the massive elliptical galaxy NGC 5128, at the positional and dynamical center of the Centaurus group. Due to its brightness and proximity, Cen A is an excellent laboratory for detailed studies of particle acceleration, production of UHECRs, and the evolution of low-power radio galaxies in general. Several authors (Moskalenko et al. 2009; Hardcastle et al. 2009; O’Sullivan et al. 2009; Gopal-Krishna et al. 2010; Pe’er & Loeb 2012) have alluded to the possibility that the production of UHECRs occurs at Cen A’s intermediate to large scales. Hardcastle et al. (2009), O’Sullivan et al. (2009) and more recently O’Sullivan (2011) have considered stochastic acceleration by magnetohydrodynamic (MHD) turbulence as the driver for this in the large-scale lobes. The southern giant lobe is particularly interesting: it seems to be detaching or detached from the rest of the source and it features two prominent filaments, named the vertex and vortex (Fig. 1), which are the brightest (in flux density) filamentary structures known in any radio galaxy. Their origin has been suggested by Feain et al. (2011) to be due to enhanced core/jet activity of the parent AGN or the passage of the dwarf irregular galaxy KK 196, a Centaurus group member at 3.98 ± 0.29 Mpc (Karachentsev et al. 2007), through the lobe.
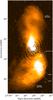 |
Fig. 1 Combined Australia Telescope Compact Array (ATCA) and Parkes 1.4 GHz radio continuum image at 60′′ × 40′′ angular resolution of the large-scale structure of Centaurus A (adapted from Feain et al. 2011), showing the giant lobes and the vertex and vortex filaments. The jets, inner lobes and the northern middle lobe are located in the saturated region centred on the nucleus. The elongated feature in the north-west part of the southern giant lobe, aligned approximately with the inner lobes, is the background FR I radio galaxy PKS B1318–434 of the Centaurus cluster at ~45 Mpc. |
The jets in various FR I radio galaxies have been successfully described as turbulent, entraining, decelerating flows (e.g. 3C 31, Laing & Bridle 2002; Perucho & Martí 2007; Wang et al. 2009; B2 0326+39 and B2 1553+24, Canvin & Laing 2004; NGC 315, Canvin et al. 2005; 3C 296, Laing et al. 2006) with the entrainment process strongly affecting the evolution of the source. The approaching (i.e. northern) jet in Cen A has been traced out to a projected length of ~5 kpc in radio and 4.5 kpc in X-rays, and from the changing properties of the X-ray emission at about 3.7 kpc from the nucleus, Hardcastle et al. (2006) have alleged that the approaching jet enters the northern inner lobe at that point. Based on deep Chandra observations, Hardcastle et al. (2007) have claimed that the receding jet extends out to ~2 kpc in projection in X rays, and it also shows up on a similar scale in radio (Tingay et al. 1998; Hardcastle et al. 2003), albeit only discernible through a few faint knots.
The inner lobes of Cen A are embedded in the thermal interstellar gas of NGC 5128 (e.g. Feigelson et al. 1981). They show up in radio and X-rays, with each lobe having a projected size of approximately 5 kpc. The so-called middle lobe, regarded by Morganti et al. (1999) as an extension of the north-east inner lobe, has a size of ~30 kpc in projection and has no visible counterpart in the south. Based on their detection of extended thermal X-ray emission from this region, Kraft et al. (2009) interpret the northern middle lobe as an old structure that has recently become reconnected to the energy supply from the jet. Multiple age estimates for the individual lobes exist in the literature (Morganti et al. 1999; Saxton et al. 2001; Kraft et al. 2003, 2009; Croston et al. 2009), based on the dynamics. Each of the two giant lobes (Fig. 1) extends about 280 kpc in projection and is positioned at a large angle to the inner lobes. Hardcastle et al. (2009) have derived spectral ages of the giant lobes of ~30 Myr.
X-rays produced by inverse-Compton scattering of cosmic microwave background photons are expected from the lobes of all FR I radio galaxies, though only a couple of examples (e.g. Centaurus B, ASCA, Tashiro et al. 1998; NGC 6251, Suzaku, Takeuchi et al. 2012) are known so far. The fields of view of Chandra and XMM-Newton are too small to map the giant lobes of Cen A and also the distribution of group gas surrounding them. ASCA did detect thermal emission from hot gas in a region associated with the northern giant lobe (Isobe et al. 2001), and most recently, Stawarz et al. (2013) have claimed thermal and non-thermal X-ray detection with Suzaku of parts of the southern giant lobe, though they do not detect inverse-Compton emission. INTEGRAL hard X-ray observations of Cen A’s giant lobes by Beckmann et al. (2011) are consistent with non-detection. The analysis of gamma-ray data by Abdo et al. (2010) and Yang et al. (2012) has shown that the gamma-ray radiation emanating from Cen A’s giant lobes is of inverse-Compton origin, and that the lobes are particle dominated by a factor of a few. This is congruous with the results for the other two FR I galaxies resolved by Fermi-LAT, NGC 6251 (Takeuchi et al. 2012) and Centaurus B (Katsuta et al. 2013).
In this paper we attempt to infer whether the properties of the giant lobes required for UHE particle acceleration are consistent with properties obtained from the constraints on energy input from the jet, on particle cargo and on dynamics. The paper is organised as follows. In Sect. 2, we investigate physical conditions in Cen A’s jets: we derive the jet power and place constraints on the energy density and entrainment rates. We focus on some of the fundamental physics – the temperature of the thermal gas and the pressure and particle content – of the giant lobes in Sect. 3, placing constraints on them using environmental information. We contrast the energy and particle supply through the jet with the pressure and energy content of the lobes and find that, to meet the pressure requirements, the protons must be unconventionally hot or relativistic. Finally, in Sect. 4, we explore the feasibility of stochastic UHECR acceleration models and the role of MHD turbulence and magnetic reconnection. Our main results and their implications are summarised, and prospects for current and future observations are drawn in Sect. 5.
Spectral indices α are defined in the sense Sν ∝ ν− α, and particle indices p as n(E) ∝ E− p.
2. Physical conditions in the jets
In this section we evaluate the degree of agreement between various jet power estimates, and investigate the energetics and mass loading of the jet. We compute the entrainment rates from hot gas and from stars within the jet and balance these values with requirements imposed by the pressure constraints on the lobes, which we will employ in Sect. 4.3 in a consistency analysis when we consider stochastic particle acceleration in the large-scale lobes.
2.1. Jet power
Croston et al. (2009) calculated a jet power for Cen A of ~1 × 1043 erg s-1 based on the enthalpy of the southern inner lobe and its age estimated from the shock speed around the lobe of ~2 Myr, and an instantaneous jet power of 6.6 × 1042 erg s-1 using the shock speed of 2600 km s-1. Applying the simple model of Falcke & Biermann (1999), which relies on a relation between jet power and accretion disk luminosity, we infer from their Eq. (20) a total jet power of ~1.6 × 1043 erg s-1, adopting a core flux density of 3.9 Jy at 8.4 GHz (Müller et al. 2011), 3.8 Mpc for the distance (Harris et al. 2010), a black hole mass of 5.5 × 10⁷ M⊙ (Cappellari et al. 2009) and a jet viewing angle of 50° (Tingay et al. 1998; Hardcastle et al. 2003). Such a jet power is in reasonable agreement with the previous estimates, given the numerous assumptions involved. Note that increasing the viewing angle to 70° (e.g. Jones et al. 1996; Tingay et al. 1998) in the Falcke & Biermann model boosts the jet power to ~3.3 × 1043 erg s-1.
Abdo et al. (2010) computed Cen A’s kinetic jet power of 7.7 × 1042 erg s-1 based on the synchrotron age of the giant lobes of 30 Myr (Hardcastle et al. 2009) and on an estimated total energy in both giant lobes of ~1.5 × 1058 erg. However, the imposition of the dynamical age of ~560 Myr (see Sect. 3.1) would imply much lower average jet powers or a significantly higher total lobe energy. We will elaborate on this in Sect. 3.3.
The above methods, whose outcomes we express in terms of a single jet, all yield similar values for the jet power. Since the method based on the energy content of the giant lobes gives an estimate for the average past power of the jet, this means that if the jet power was higher in the past (as conjectured by, e.g., Saxton et al. 2001; Protheroe 2010), the jet activity in Cen A must have been intermittent.
2.2. Constraints on energy density and magnetic fields
Apart from the jet power needed to drive particular features of the source (as dealt with in Sect. 2.1), the jet power that can be carried by the known particle population can be estimated.
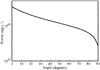 |
Fig. 2 Total jet power estimated with the formula in the text with the apparent jet speed fixed, as a function of the angle of the jet to the plane of the sky, using assumptions given by Hardcastle & Croston (2011). |
Considering the inner jet, that is the structure out to ~3 kpc of projected length, where we know the electron distribution reasonably well (see Hardcastle et al. 2006), we have a constraint on the bulk flow speed from the proper motion of the inner knots (0.5c, Hardcastle et al. 2003), and we are also confident that the magnetic field cannot be much lower than the equipartition value (Hardcastle & Croston 2011). Do we require protons (thermal or relativistic) in order to transport 1043 erg s-1, if we make the additional assumption that the jet is not magnetically dominated?1 Using the model of the jet from Hardcastle & Croston (2011) with a single electron spectrum, the mean energy density of the jet (assuming equipartition between magnetic field and electrons only) is Uj = 8.77 × 10⁻¹¹ erg cm-3. The total jet power follows from 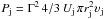 , where Γ = (1 − β2)− 1/2 is the bulk Lorentz factor and rj is the cross-sectional radius of the jet. Assuming rj = 18.8′′ (338 pc) and υj = 0.5c (see above), for our preferred viewing angle of Cen A of 50°, the total jet power is ~1.3 × 1043 erg s-1 (see Fig. 2). This suggests that the energy transport can all be done by the known population of electrons with no requirement of energetically dominant protons2. However, we cannot rule out the possibility that there is an energetically significant population of protons.
The magnetic field strength of the diffuse component of the jet is generally lower than that of the knots contained in the jet. Goodger et al. (2010) derived an equipartition value of the magnetic field of the inner knots in Cen A’s jet (of which they associated the X-ray bright knots with shocks) in the range ~220−760 μG and a non-thermal knot pressure in the range 1.3 × 10⁻⁹ − 1.5 × 10⁻⁸ dyn cm-2. It is probable that the knots are overpressured with respect to the diffuse component and also compared to the hot gas external to the jet, and we will return to pressure considerations in the next section.
2.3. Matter densities, entrainment, temperature, and pressure balance
The idea that FR I jets start off purely leptonic (or at any rate very light) and become mass loaded through entrainment, thus allowing them to decelerate to sub-relativistic speeds, has received support from the work of Laing & Bridle (2002). Mass loading may occur from hot and/or cold gas via the jet boundary (external entrainment), as a result of mass loss from stars within the jet volume (internal entrainment), or from the intermittency of the jets, i.e. when the jets restart (prompt entrainment). The prompt entrainment is expected to be insignificant compared to other contributions to the total entrainment, and we will disregard it in what follows. External entrainment from cold gas is difficult to quantify (e.g., it will not scale with distance in the same way, or with the external hot gas density as external entrainment from hot gas, see Sect. 2.3.1). Various authors (Stickel et al. 2004; Struve et al. 2010; Auld et al. 2012) have reported the existence of cold clouds along the jet axis but offer no direct evidence for jet-cloud interaction. We choose to also neglect the contribution from cold gas to the total entrainment.
There are no direct constraints on the thermal matter content of the Cen A jet. Observations of depolarisation, or Faraday rotation deviating from a λ2 law could, in principle, place constraints on the thermal electron number density of the knots (Burn 1966), when combined with known (Goodger et al. 2010, see Sect. 2.2) constraints on the knot equipartition magnetic fields and knot sizes. Clarke et al. (1992) found no evidence for internal depolarisation, so that only upper limits on the thermal electron densities can be inferred. For the knots for which we have sufficient constraints, A1A, A1B and A1C, using equipartition fields of 693, 323 and 763 μG (Goodger et al. 2010), this gives upper limits of ne,th ~ 3 × 10⁻², ~6 × 10⁻³ and ~8 × 10⁻² cm-3, respectively. These are well above the densities that we estimate from entrainment.
De Young (1986), Bicknell (1984, 1994), Henriksen (1987) and Laing & Bridle (2002) invoked external entrainment via a turbulent boundary layer, arising from Kelvin-Helmholtz (KH) instabilities at the jet boundary. Significant excursions from pressure equality between the jet and the surrounding ISM would disprove the existence of the KH instability along the jet boundary. The bright knots measured by Goodger et al. are very likely overpressured with respect to the bulk of the jet, and the minimum pressure values, 2.1 × 10⁻¹¹ − 9.2 × 10⁻¹¹ dyn cm-2, determined by Burns et al. (1983), which are for larger areas and probably closer to being representative of a “mean jet” state, still suggest overpressure. However, the minimum jet pressure, adopting our energy density value from Sect. 2.2, is pj = Uj/3 ~ 2.9 × 10⁻¹¹ dyn cm-2. The ISM pressure near the centre of the source is given in Croston et al. (2009): ~1.1 × 10⁻¹¹ dyn cm-2. Considering another location in the surrounding medium relatively close to the centre and using Kraft et al.’s (2003) values for density and temperature (see Sects. 2.3.1 and 3.1), gives ~4.1 × 10⁻¹¹ dyn cm-2, which implies that the jet is not significantly overpressured with respect to the surrounding ISM if the jet pressure is close to its minimum value, and a KH instability along the jet is thus not ruled out. An actual proof of the existence of a turbulent jet boundary associated with KH instabilities would require detailed modelling including jet speeds and internal/external temperatures, and is beyond the scope of this paper, but we regard it as possible that thermal material could be entrained across a KH unstable jet boundary. However, there is no observational evidence for a KH instability associated with Cen A’s jet.
2.3.1. External entrainment from hot gas
To estimate the level of external entrainment we will consider a jet that propagates in direct contact with the host galaxy’s ISM. Our approach resorts to the use of simple scaling relations with position along the jet and we consider the results of Laing & Bridle (2002) for 3C 31 to normalise the entrainment rate profile. We assume that the mass entrained per unit time for a section of jet of length Δl scales according to the external gas density, the jet velocity, and the surface area of the jet segment, i.e.  (1)Then the entrainment rate per unit length is
 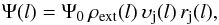 (2)where Ψ0 is a normalisation factor, l is distance along the jet, ρext(l) is the external mass density, υj(l) the jet velocity, and rj(l) the jet radius at distance l.
We assume that the external thermal number density is described by a beta model (e.g. Cavaliere & Fusco-Femiano 1976): ![Mathematical equation: \begin{equation} n_{\rm th} = n_{\rm 0}\left[1 + (l / a)^2\right]^{-3\,\beta/2} , \end{equation}](/articles/aa/full_html/2013/10/aa21622-13/aa21622-13-eq54.png) (3)where a denotes a scale radius, β a slope parameter, and n0 the external number density at l = 0 3. For Cen A we adopt the beta model parameters from Kraft et al. (2003): a = 0.5 kpc, β = 0.39 and np,0 = 0.037 cm-3.
(3)where a denotes a scale radius, β a slope parameter, and n0 the external number density at l = 0 3. For Cen A we adopt the beta model parameters from Kraft et al. (2003): a = 0.5 kpc, β = 0.39 and np,0 = 0.037 cm-3.
We assume that the jet velocity is approximately constant over the inner 2 kpc of Cen A, and we assume that the jet radius rj is proportional to distance l, consistent with the fairly constant opening angle observed over the region being considered. We can then separate out the entrainment rate into normalisation and distance-dependent terms: ![Mathematical equation: \begin{equation} \Psi(l) = \Psi_{\rm norm}\, l \left[1 + (l/a)^{2}\right]^{-3\, \beta/2} . \end{equation}](/articles/aa/full_html/2013/10/aa21622-13/aa21622-13-eq62.png) (4)We determined the normalisation Ψnorm by taking an estimate of the entrainment rate in the middle of the flaring region of the 3C 31 jet (based on the Laing & Bridle 2002 model) – choosing a radius of 2 kpc. Based on the jet geometry from high-resolution radio data, and the extent of the X-ray jet in the two sources, we conclude that the equivalent point within the flaring region of the Cen A jet is at around 0.7 kpc. We scale the entrainment rate at 2 kpc for 3C 31 (Ψ = 4 × 10²² g s-1 kpc-1) based on the ratio of external density, jet velocity and jet radius at these equivalent points as follows: ρCenA/ρ3C 31 = 0.33, υCen A/υ3C 31 ~ 1, and rCen A/r3C 31 = 0.08. This leads to an estimated entrainment rate for Cen A at 0.7 kpc of ~1.1 × 10²¹ g s-1 kpc-1, and a normalisation for the entrainment rate profile of Ψnorm ~ 2.8 × 10²¹ g s-1 kpc-2. Integrating the entrainment rate profile between l = 0 and 3 kpc implies a total entrainment rate of ~3.0 × 10²¹ g s-1 (~4.7 × 10⁻⁵ M⊙ yr-1). Assuming a mean particle mass of 0.6 mH, this is ~9.4 × 1052 particles yr-1. Adopting a lifetime for the inner lobes of 2 Myr (Croston et al. 2009) gives a total mass injection of 1.9 × 1035 g (~94 M⊙).
(4)We determined the normalisation Ψnorm by taking an estimate of the entrainment rate in the middle of the flaring region of the 3C 31 jet (based on the Laing & Bridle 2002 model) – choosing a radius of 2 kpc. Based on the jet geometry from high-resolution radio data, and the extent of the X-ray jet in the two sources, we conclude that the equivalent point within the flaring region of the Cen A jet is at around 0.7 kpc. We scale the entrainment rate at 2 kpc for 3C 31 (Ψ = 4 × 10²² g s-1 kpc-1) based on the ratio of external density, jet velocity and jet radius at these equivalent points as follows: ρCenA/ρ3C 31 = 0.33, υCen A/υ3C 31 ~ 1, and rCen A/r3C 31 = 0.08. This leads to an estimated entrainment rate for Cen A at 0.7 kpc of ~1.1 × 10²¹ g s-1 kpc-1, and a normalisation for the entrainment rate profile of Ψnorm ~ 2.8 × 10²¹ g s-1 kpc-2. Integrating the entrainment rate profile between l = 0 and 3 kpc implies a total entrainment rate of ~3.0 × 10²¹ g s-1 (~4.7 × 10⁻⁵ M⊙ yr-1). Assuming a mean particle mass of 0.6 mH, this is ~9.4 × 1052 particles yr-1. Adopting a lifetime for the inner lobes of 2 Myr (Croston et al. 2009) gives a total mass injection of 1.9 × 1035 g (~94 M⊙).
2.3.2. Internal entrainment
We next calculate the entrainment from stars within the jet volume by estimating the total mass loss rate for the stellar population of Cen A, determining the fraction of this mass loss that occurs within the jet boundaries, and considering all this mass to be entrained. We assume that the contained stars are not affected by the jet plasma. We know (e.g. Komissarov 1994; Bowman et al. 1996) that mass loss in ellipticals is dominated by old-population stars, with B-band luminosity-to-mass-loss-rate ratio of 7.88 × 10⁻¹² (LB / LB ⊙) M⊙ yr-1 (Athey et al. 2002; see also O’Sullivan et al. 2011). The apparent magnitude mB of Cen A is 7.48 (Tully 1988), from which we derive the luminosity LB ~ 2.43 × 10¹⁰ LB ⊙. Hence we obtain a total mass loss rate of ~0.19 M⊙ yr-1. Adopting a spherically symmetric distribution, the fraction of the stars that lie within the jet is determined by the jet’s solid angle: with Cen A’s jet opening angle of 15° (Goodger et al. 2010), the solid angle is 0.054 steradians. This gives an entrainment rate from stars inside the jet of ~5.2 × 10²² g s-1 (8.2 × 10⁻⁴ M⊙ yr-1) which converts to 1.6 × 1054 particles yr-1. The internal entrainment is thus slightly larger than that from the hot ISM, which is not unexpected, as even for 3C 31 where the galaxy environment has much less gas content, internal entrainment dominates the central parts.
Reflecting the presence of a starburst around Cen A’s nuclear region, we also consider the mass loss from O stars. We assume that the Cen A FIR luminosity of 3.4 × 1043 erg s-1 (~8.9 × 10⁹ L⊙) arises entirely from dust heated by type O stars, and that 50% (Gil de Paz et al. 2007) of the output of these stars goes into heating the dust. Given a luminosity per star of L = 3 × 10⁵ L⊙ (for an O6.5 star, from Vacca et al. 1996), we have 5.9 × 10⁴ such stars, each with a mass loss rate of 1 × 10⁻⁶ M⊙ yr-1, for a total mass loss rate of 5.9 × 10⁻² M⊙ yr-1 ~ 1.2 × 1032 g yr-1. Adopting a spherically symmetric distribution and the solid angle as above, the entrainment rate from O stars inside the jet is ~1.6 × 10²² g s-1 which converts to 5.0 × 1053 particles yr-1. This is a factor of a few less than the rate invoking AGB stars, summing to an internal entrainment rate of ~6.8 × 10²² g s-1. Laing & Bridle (2002) used a variant of those methods and derived for 3C 31 an internal entrainment of ~4.9 × 10²³ g s-1.
2.3.3. Pressure balance in the inner lobes
We have good constraints on the internal pressure required in the inner lobes of Cen A from the shock conditions of the south-west lobe (Croston et al. 2009). The total required internal pressure is pSW − IL = 1.1 × 10⁻¹⁰ dyn cm-2, where constraints from the radio observations using the assumption of equipartition imply that the relativistic pressure is ~10% of this, and hence pth ~ 1 × 10⁻¹⁰ dyn cm-2. The volume of the inner south-west lobe is ~1.6 × 1066 cm3 (Croston et al. 2009), and so this implies a thermal particle number Nth ~ 4.5 × 1060 (assuming again a mean particle mass of 0.6 mH) and thus nth ~ 2.8 × 10⁻⁶ cm-3.
Given the total amount of entrained material, it would need to be heated to a temperature of ~2.6 × 10¹¹ K to balance the pressure offset in the southern inner lobe4. Pressure support to Cen A’s southern inner lobe supplied by either protons or lower-energy relativistic electrons has been proposed earlier by Kraft et al. (2003); and in a more general case, Boehringer et al. (1993), Carilli et al. (1994), Hardcastle et al. (1998), Dunn & Fabian (2004), Bîrzan et al. (2008), Diehl et al. (2008) and Takeuchi et al. (2012), for example, argued for other particles in addition to relativistic electrons to match a missing pressure in other sources’ lobes. We will handle pressure balance with regard to Cen A’s giant lobes in Sect. 3.2.
3. Physical conditions in the giant lobes
Our objective is to assess the pressure and temperature of the thermal gas and particle content of the giant lobes, and to touch on energy distribution in the lobes. We begin by addressing several of the relevant morphological features of the lobes and by putting constraints on the lobe ages. Limits on lobe ages are required to evaluate the power of the jet that inflated the giant lobes (Sect. 3.3) and to estimate the number of thermal protons entrained over the lifetime of the source (Sect. 3.3.1).
3.1. Size and age
With the 1.4 GHz images of Feain et al. (2011) as a guide, and approximated as prolate spheroids with major and minor axes of 280 × 170 kpc and 280 × 190 kpc, the northern and southern giant lobes occupy volumes of ~1.2 × 1071 cm3 and ~1.6 × 1071 cm3 respectively5. These sizes and volumes should be considered a lower limit, as the giant lobes may not lie perfectly in the plane of the sky. Feain et al. (2011) have argued that the southern giant lobe is disconnected from the rest of the source and Stefan et al. (2013) report a similar “gap” at 150 MHz, yet we cannot exclude the possibility that the southern lobe is in the process of detachment, or is fully connected. If the lobe were connected, the fainter region could be explained because the synchrotron emission is a non-linear tracer of the underlying plasma ( ), so that a small decrease in relativistic particles, magnetic field, or both can result in a large decrease in synchrotron brightness.
Hardcastle et al. (2009) derived synchrotron ages of tsync ~ 25 Myr and ~27 Myr for, respectively, Cen A’s northern and southern giant lobes. If we proceed with calculating the sound-crossing timescale  (5)(see, e.g., Bîrzan et al. 2004; Dunn & Fabian 2004; Dunn et al. 2005; McNamara & Nulsen 2007), where R is the distance to the lobe edge and
  the local sound speed, by using the well-determined (Kraft et al. 2003) temperature of kT ~ 0.35 keV (i.e. ~4.1 × 10⁶ K) and R = 280 kpc, the ratio of specific heats γ = 5/3 and the mean particle mass μ = 0.62, we get tcs ~ 920 Myr. However, the value of 0.35 keV applies to the external medium on the scales of the inner lobes. The temperature of the plasma into which the giant lobes are expanding over most of their lifetime is currently inaccessible, but could easily be higher, and we estimate it in Sect. 3.2 to be in the range kT = 0.7 − 1.5 keV (i.e. ~8.1 × 10⁶ − 1.7 × 10⁷ K), resulting in a more likely sound-crossing timescale in the range ~440 − 645 Myr. The uncertainty in the projection angle of the giant lobes makes those values a lower limit.
The discrepancy between the figure for the synchrotron age and the sound-crossing timescale is not surprising: using spectral breaks (and inferred synchrotron age) to estimate the physical age of a source can be misleading, especially if in situ re-acceleration is taking place (e.g. Pacholczyk & Scott 1976; Alexander 1987; Eilek et al. 1994, 1997; Bicknell 1995; Feretti et al. 1998; Katsuta et al. 2013), as envisaged for the giant lobes of Cen A (Abdo et al. 2010; Feain et al. 2011; Stawarz et al. 2013; Stefan et al. 2013, and this paper).
In addition, given that one of the giant lobes is considered to be disconnecting/disconnected – although this is not a strict requirement; the buoyant force on the outer ends of the giant lobes just needs to be larger than any other force – we compute the buoyancy age for the lobes. The buoyancy age is given as  (6)where we take Rdist to be the distance from the AGN core to the edge of the giant lobe6 and the buoyancy velocity
  , in which V stands for the lobe volume and S for its cross-sectional area (e.g. Faber 1995; Churazov et al. 2001; Bîrzan et al. 2004; Dunn & Fabian 2004). We assume a drag coefficient CD = 0.75 as in Churazov et al. (2001). Since the buoyant blob has to be small compared to the scale over which gravity varies (e.g. Faber 1995), Eq. (6) is not appropriate for the entire vertical, long giant lobe. Adopting a spherical bubble with radius of 80 kpc (i.e., an approximate radius of the giant lobes towards their outer edges) which gives us a volume of ~6.3 × 1070 cm3, and taking gravitational acceleration7g resulting from an enclosed gravitating mass of Mgrav( <Rdist) ~ 1.4 × 1046 g (based on the mean of the orbital and virial masses from Karachentsev et al. 2007 determined using the harmonic radius of 192 kpc), results in υbuoy ~ 4.9 × 107 cm s-1 and hence, appealing to the adopted lobe edge R = 280 kpc, in tbuoy ~ 560 Myr. This puts the buoyancy age and sound-crossing times close, as expected from basic physics (virial theorem). However, the above derived buoyancy age is probably a conservative estimate, reflecting the dependence on other physics (ram pressure or high internal pressure exceeding the buoyancy force during some period of the lobe growth will make the lobes younger), on the projection (an inclination angle would make the lobes older), and, to a lesser extent, of the drag coefficient on the Reynolds number (for the latter dependence see Faber 1995). No independent age estimates are available from, e.g., proper motion from the edge-like features (the wisps, see Feain et al. 2011).
Dynamical age estimates for FR I sources are scarce, and we can only compare with 3C 31 for which Perucho & Martí (2007) derived >100 Myr, and with J1453+3308 (a FR I/FR II source) for which two estimates exist in the literature: 215 Myr (Kaiser et al. 2000) and ≤134 Myr (Konar et al. 2006).
3.2. Matter densities, pressure and temperature
Based on Faraday RMs and linearly polarised intensities of background sources, and adopting the path length through the lobes as 200 kpc, a magnetic field strength in the lobes of 1.3 μG and assuming no field reversals along the line of sight throughout the lobes, Feain et al. (2009) placed a limit on the volume-averaged thermal electron number density of Cen A’s giant lobes of ne,th ≲ 5 × 10⁻⁵ cm-3. Using B = 0.9 μG (from Abdo et al. 2010, see Sect. 3.3) this limit becomes ne,th ≲ 7 × 10⁻⁵ cm-3. There are claims (Stawarz et al. 2013; O’Sullivan et al. 2013) that the thermal particle number density of Cen A’s giant lobes may be as high as ~1 × 10⁻⁴ cm-3; however, this is inconsistent with observations of X-ray surface brightness decreases (cavities) in other radio galaxies. Moreover, Stawarz et al.’s thermal X-ray detection may be interpreted in terms of Galactic foreground emission (in their Fig. 7, an extended region of X-ray emission contiguous with Galactic emission appears to lie on top of the regions they use).
Let us now derive constraints on the internal pressure, temperature and particle content of the giant lobes, considering environmental constraints. Karachentsev et al. (2007) give a total mass for the Centaurus group of (7 − 9) × 1012 M⊙. Sanderson et al. (2003) show well-constrained Mtot – TX and LX – TX relations for a sample of (relaxed) galaxy groups and clusters (with ~12 sample members having temperatures below 2 keV, so in the group regime). Using their Mtot – TX relation, the above mass for the Centaurus group implies an X-ray gas temperature between 0.7 and 1.5 keV, which in turn implies an X-ray luminosity between 1042 and 1043 erg s-1.
These X-ray luminosities are very typical of radio-galaxy group-scale environments (e.g. Croston et al. 2008). If we consider systems of similar luminosity for which the external pressure profiles have been mapped, there are ~5 systems in Croston et al. (2008): NGC 6251, NGC 1044, 3C 66B, NGC 315 and NGC 4261. Their thermal pressures at ~100 kpc range from (1 − 5) × 10-12 dyn cm-2, and at 300 kpc (i.e. comparable to the distance to the outer edge of the Cen A giant lobes) from (1 − 10) × 10-13 dyn cm-2.
If we take the median values of the external pressure at these radii, we have some plausible (if not well-constrained) estimates of the required internal pressure, assuming that the lobes are within a small factor of pressure balance.
The Fermi-LAT inverse-Compton analysis (Abdo et al. 2010) gives a relativistic pressure equal to prel = 5.6 × 10⁻¹⁴ dyn cm-2 (northern giant lobe) and 2.7 × 10⁻¹⁴ dyn cm-2 (southern giant lobe). The Fermi-LAT results therefore imply ratios at 100 kpc (~giant lobe midpoints) of ptot/prel = 18 − 90 (northern giant lobe) and 37−185 (southern giant lobe), which means that the pressure would have to be dominated by non-radiating particles – thermal or not.
For these ratios, if we assume the pressure is dominated by thermal particles, we can infer the density of thermal particles in the giant lobes for various electron temperature assumptions. If we assume an internal temperature T ~ 107 K, as claimed by Isobe et al. (2001) on the basis of detected diffuse X-ray emission, then ne,th ~ 1 × 10⁻³ cm-3, which is inconsistent with the Faraday rotation limits of Feain et al. (2009) and also our revised value. Adopting instead the limit of ne,th ≲ 7 × 10⁻⁵ cm-3, and taking a mean thermal pressure of 1.5 × 10⁻¹² dyn cm-2 following our modelling above, then we find a lower limit to the temperature of ~1.6 × 10⁸ K.
There is reason to favour such a high temperature for the thermal gas, based on observations of cavities associated with radio lobes in other galaxies (e.g. Bîrzan et al. 2004), which imply that the temperature of thermal material contained within lobes must be sufficiently high to provide the required pressure with comparatively low density gas so as to minimize thermal bremsstrahlung. Limits on the temperature of this gas have been obtained by several authors: e.g. >15 keV (Hydra A, Nulsen et al. 2002), >20 keV (Abell 2052, Blanton et al. 2003), >50 keV (Perseus A, Sanders & Fabian 2007).
If our density estimates from entrainment (Sect. 3.3.1) are correct then the thermal material must be very hot indeed. Our constraint on np,th (Sect. 3.3.1) combined with our thermal lobe pressure of ~1.5 × 10⁻¹² dyn cm-2, gives a temperature estimate of ~2.0 × 10¹² K. This means that if the protons provide the missing pressure that we claim in Sect. 3.2 (but note that there is no direct observational evidence for the statement that this is the amount of pressure we need) then they must be very hot. However, to put this in context, k × 1012 K is only ~10% of the proton rest mass, so the protons have the same energy as γ ~ 250 electrons, which are abundant in the giant lobes. Hence, there is a self-consistent model in which the entrained protons from Sects. 2.3.1 and 2.3.2 are heated to ~1012 K (i.e. mildly relativistic) and then provide the missing pressure while still allowing UHECR acceleration; and that, even ignoring the UHECR models, this is the only model that explains what would otherwise be a discrepancy between the number of protons we expect to be entrained and the number we need in the inner/giant lobes (Sects. 2.3.1 and 2.3.2). Note that in case of jet intermittency over the lifetime of the AGN, even less material may be available to match the pressure.
In summary, there is a self-consistent model where the external pressures are comparable to well-studied FR I radio galaxy environments, the thermal particle density is well below the limits from radio polarisation, and the thermal material in the lobes is hot.
3.3. Magnetic field estimates and global energetics
The use of radio observations in conjunction with X-ray or gamma-ray data permits a direct appraisal of the magnetic field strength. Observations at gamma-ray frequencies are preferable as these are not hampered by thermal bremsstrahlung as in casu X-ray bands. Based on radio data presented by Hardcastle et al. (2009) and the detection of soft gamma rays from the giant lobes of Cen A (Abdo et al. 2010), the latter authors obtained a field strength of B = 0.89 μG and 0.85 μG for the entirety of respectively the northern and the southern giant lobes. Their computed energy density ratio Ue/UB = 4.3 for the northern and 1.8 for the southern giant lobe indicates modest electron pressure dominance, which is analoguous to the values for the lobes of, e.g., Centaurus B (Ue/UB ~ 4.0; Katsuta et al. 2013). As a cautionary note, since the particle index p1 used by Abdo et al. (2010) for the southern giant lobe is rather low and gives rise to a significantly lower value of Ue/UB than found elsewhere in the source, we use the Ue/UB value for the northern lobe in the Alfvén speed derivation in Sect. 4.3.3.
Using the Fermi-LAT Table S1 entries, we calculate the relativistic electron number densities for the four giant lobe sectors (defined in Hardcastle et al. 2009): sector 1, ne,rel ~ 7.9 × 10⁻⁹ cm-3; sector 2, ne,rel ~ 1.5 × 10⁻⁸ cm-3; sector 4, ne,rel ~ 1.0 × 10⁻¹¹ cm-3 and sector 5, ne,rel ~ 2.9 × 10⁻¹⁰ cm-3; these are notably different from one another. The reason for the widely varying electron number densities are presumably the substantial variations in the synchrotron surface brightness across these regions. Yang et al. (2012) updated the inverse-Compton analysis based on a Fermi-LAT data set of three times the size of the Abdo et al. (2010) analysis, in which they confirm the earlier results for Ue/UB.
The Fermi-LAT analysis and their resulting total energy Etot ~ 7.3 × 1057 erg per giant lobe only considers electron-positron plasma. In our picture the total energy supply must have been provided by the jet; significant contribution of non-radiating particles to the giant lobe pressure (as we envisage in the preceding section) increases their inferred value for Etot. In Sect. 4.3.3 we derive a proton pressure of pp ~ 1.5 × 10⁻¹² dyn cm-2. The total energy of an individual giant lobe, taking the mean lobe volume of 1.4 × 1071 cm3, is then Etot = 4pe + p + B Vl ~ 8.8 × 1059 erg; as a corollary, the power estimate of the jet that inflated the giant lobes increases (adopting our buoyancy age8 of 560 Myr) to ~5.0 × 1043 erg s-1. In this picture, the agreement between the jet power derived for the giant lobes by Abdo et al. (2010) and the estimate made in the inner jets is coincidental, since we would argue that both the energy content and the lobe age that they estimate are too low.
The minimum pressure analyses in the literature make the conservative assumptions that there are no relativistic baryons, and that the emitting volume is uniformly filled. For the giant lobes, we are not using an equipartition field but one determined by Abdo et al. (2010) using inverse-Compton, and the traditional parameter k, i.e. the ratio of the total particle energy density to that in relativistic electrons, does not affect such measurements. The plasma filling factor f does, but in a slightly more complicated way (see discussion in Hardcastle & Worrall 2000): only if the electrons had a very low f could such a model give much larger pressures than the inverse-Compton value, and such a model also requires a high-pressure non-radiating fluid.
3.3.1. Electron-positron and proton content
So far, we have made no assumption about whether the relativistic material is electron-positron or electron-ion plasma, excepting the jet on the smallest scales (Sect. 2.3) for which we assume a (nearly) pure electron-positron plasma. All of our estimates of energy densities (Ue,rel) and pressures (pe,rel) in the radiating particles account for positrons.
Since cooling is energy-dependent, the relativistic electron-positron population on the smallest scale is expected to remain non-thermal while propagating along the jet. The electrons do not approach sub-relativistic energies for realistic lifetimes.
We associate the thermal component of the jet/lobes with thermal electrons and positrons from external and internal entrainment. Note that by “thermal protons” we mean “thermal protons and electrons” just as with “relativistic electrons” we mean “relativistic electrons and positrons”. It is reasonable to expect that the entrained electrons and positrons will behave in the same way as the thermal protons, but we do not know whether either species is heated or turned into a non-thermal distribution via particle acceleration processes; no statement is possible on the fraction of the entrained electrons and positrons which becomes non-thermal while being transported along the jet.
Pure thermal electron-positron plasma would be excluded by a Faraday rotation detection, yet we have no firm constraints on this in either the jet or the giant lobes. The thermal electrons and positrons are not required for energy transport in the jet (see Sect. 2.2), and their temperature in the jet is not constrained by any observation we can make.
Considering the total entrainment rate of 7.1 × 10²² g s-1, the buoyancy age of 560 Myr, and the average volume of the giant lobes, 1.4 × 1071 cm3, we obtain a ballpark figure for the thermal proton number density in the giant lobes of np,th ~ 5.4 × 10⁻⁹ cm-3. We expect on charge balance grounds that ne,th ≃ np,th. The consistency with the upper limit on ne,th (Sect. 3.2) is trivially true, and we know by the lack of low-frequency Faraday depolarisation (e.g. Willis et al. 1978; Jägers 1987) and by direct observation of cavities of other radio galaxies (e.g. Bîrzan et al. 2004) that there is at least several orders of magnitude difference between the internal and external densities. For the Centaurus intragroup medium, O’Sullivan et al. (2013) have suggested nth ~ 1 × 10⁻⁴ cm-3.
Therefore, we will calculate the Alfvén speed (Sect. 4.3.3) on the assumption of only two components of the (non-magnetic) energy density and pressure: a relativistic component whose energy density is constrained by the synchrotron and inverse-Compton observations, and a thermal electron/proton plasma whose density and temperature are constrained by the external pressure and entrainment arguments given above and in Sect. 3.2.
4. (UHE)CR acceleration
In this section we investigate whether the models we have presented for the particle content and energetics of the giant lobes of Cen A are consistent with a scenario in which UHECR are accelerated in the giant lobes. Specifically, in Sect. 4.1, we derive UHECR power, in Sect. 4.2, we assess abundances in the giant lobes and the prevalent particle species available for acceleration. In Sect. 4.3, we discuss magnetic field fluctuations in the plasma of the giant lobes and their role in lepton and hadron acceleration along with possibilities for turbulent input, maintainance, heating and dissipation, and we discuss scenarios in which particles are subject to a hybrid mechanism invoking magnetic reconnection that could provide seeds for further energisation in the lobes.
4.1. UHECR luminosity and power
The Pierre Auger Collaboration (2010b) measured 13 events ≥55 EeV within a radius of 18° from Cen A, with associated energies totalling 888 EeV. With the distance to Cen A of 3.8 Mpc, and correcting for PAO’s directional exposure (isotropic exposure of 20 370 km2 yr sr, exposure to Cen A of 3095 km2 yr), the UHECR luminosity is ~2.5 × 1039 erg s-1. Assuming a particle number flux spectrum as E-2, this gives a luminosity of dL/dE = kE-1, where k is a normalisation constant: k = LUHECR/(1/Emin,norm − 1/Emax,norm) = 2.5 × 1039 erg s-1/(1/55 EeV−1/84 EeV) ~ 1.33 × 1047 erg2 s-1. For the high-energy cutoff we adopt the highest energy of the events reported in the Pierre Auger Collaboration (2010b), Emax = 142 EeV. The low-energy cutoff is uncertain, but the total energy depends only weakly on this value: we use Emin = mpc2 ~ 938 MeV. We find that the ratio between LUHECR and the power put into cosmic rays in total is ~25 (i.e., protons ~ 27.1,  ,
,  ,
,  ). This means about 6 × 1040 erg s-1 goes into CRs of all types, which is reasonable given the jet power, and it leaves room for energy to go into other particle populations.
4.2. Enrichment
Hardcastle’s (2010) estimate of ~1 iron nucleus per 105 protons in the giant lobes refers to the hot ISM and so only considers external entrainment. AGB stars and O stars produce intermediate-mass nuclei (see in this context e.g. Karakas 2010) which are incorporated through internal entrainment, however they do not produce the isotope  , and solely inject at the initial abundances, which are insignificant. Therefore, effectively, internal entrainment will entrain material which will be enriched with the lighter intermediate elements (mainly the CNO nuclei) with respect to the externally entrained material. The acceleration of these nuclei in the giant lobes could increase the UHECR flux. Hence, the thermal material in the giant lobes may well be enriched in light elements from stellar winds from stars within the jet; this alleviates the objection of Liu et al. (2012) to the giant lobes as a source of UHECRs and may help to explain the PAO composition results (as per, e.g., the Pierre Auger Collaboration 2011b, 2013). A mounting body of reasoning (e.g. Fargion 2008; Biermann & de Souza 2012), based on disparate analyses, is beginning to support the dominance of light to intermediate nuclei.
4.3. Turbulence and Alfvénic acceleration
Giant lobes of FR I sources are expected to be turbulent to some degree (e.g. Cavallo 1978). Junkes et al. (1993) alluded to the possibility that the chaotic behaviour of polarisation associated with the southern giant lobe of Cen A may well be due to internal turbulence, and Feain et al. (2009) found a depolarised signal and RM fluctuations intrinsic to the southern giant lobe of Cen A that they ascribe to turbulent magnetised plasma inside the lobe.
Eilek (1989) argued that MHD turbulence will engender fluctuations in the total radio intensity. Standard fluid turbulence studies find an outer scale (i.e. driving scale) of the turbulence which is some fraction of the width of the flow; 1/7 “classically”, and no larger than some large fraction (~1/3) of the size of the system. Observations of synchrotron structure at 1.4 GHz on nearly the largest lobe scale (Feain et al. 2011) require that there must be magnetic field structure on these scales, and so are consistent with the idea that there is turbulence on these scales too. The Cen A literature shows a spread of driving scales, or maximum eddy sizes (assuming forward cascade), in these lobes, λmax = 10 kpc (O’Sullivan et al. 2009; O’Sullivan 2011) up to λmax = 100 kpc (Hardcastle et al. 2009). The smallest driving scale, 10 kpc, seems invalidated by the 1.4 GHz observations (Feain et al. 2011) at ~50′′ angular resolution – among other the filament sizes. In our model for particle acceleration, power in turbulence on scales ≳100 kpc would have little or no effect on particle acceleration even if it were present, both because the scattering on Alfvén waves would be inefficient9 and because the gyroradius of such particles would approach the size of the lobes, and so it is reasonable to adopt a scale of 100 kpc as a hard upper limit. Since the largest scale of coherent filamentary structures in the lobes is around 30 kpc, we adopt this as the minimum possible driving scale for turbulence. As the true driving scale for turbulence must lie within this range (though consideration of the hydrodynamics might favour lower values), we discuss all parameters that depend on this scale using the two extreme values of λmax.
4.3.1. Turbulent input, maintenance and dissipation
On energetic grounds, the turbulent input most likely originates from the jet. The question is whether either or both giant lobes are still connected to the energy supply, and, obviously, if we require UHECR acceleration by this method, what the timescale for decay of turbulence is. We deal with the latter by writing τt = ζλmax/υt, for which we adopt a numerical factor ζ = 2 (e.g. Mac Low et al. 1998 and references therein), the driving scale λmax = 30 − 100 kpc, and the turbulent speed υt = 0.063c (see below). This gives us ~3 − 10 Myr, which means that, after the energy supply by the jet to the giant lobes has ceased, in the aftermath of the old jet activity another few Myr are available for turbulent acceleration. If the current jet is the one powering the inner lobes, then it cannot be older than the lobes it has formed, and we have a robust constraint on the age of those (2 Myr, Croston et al. 2009).
An attractive alternative might be turbulent input from explosions of massive stars in the starburst at Cen A’s core. Taken at face value, the starburst may be both too far from the lobe and energetically inadequate – multiplying the supernova rate in Cen A by the available mechanical energy in supernovae (1 × 1051 erg) suggests that one supernova would be needed every ~3 years to compare to the jet. This does not tally with observations given that the last supernova seen in Cen A was SN 1986 G (Evans 1986; Cristiani et al. 1992), not to mention the difficulty of getting that energy to impact exclusively on the lobe. Admittedly, it is somewhat unclear whether SN 1986 G is a firm benchmark as one might have missed supernovae going off in the dusty regions of the galaxy. Even so, the rate would have to be several orders of magnitude higher than observed to deal with the coupling to the giant lobe scale. We therefore view the starburst activity as a very small, if not non-existent, additional contribution to the turbulent input to the lobe.
We also disregard turbulent input from galaxy mergers: the physical picture is more relevant for, e.g., intracluster media (see de Plaa et al. 2012), let alone the timescale of the last merger associated with NGC 5128 which is estimated to be significantly larger than a few Myr (e.g. Rejkuba et al. 2011).
If we suppose that the magnetic field is maintained by a turbulent MHD dynamo, then the proposition also implies  . Using np,th = ne,th = 5.4 × 10⁻⁹ cm-3 (see Sect. 3.3.1) and B = 0.9 μG (from Abdo et al. 2010) puts a constraint on the turbulent speed of ~1.9 × 109 cm s-1 (~0.063c). Reassuringly, this is close to the Alfvén speed in the lobes as we derive in the subsequent section, therefore the requirement υt ~ υA, as applies in the turbulent MHD dynamo, is satisfied.
In a driven lobe, the turbulent energy is dissipated at a rate  . Using the above values υt ~ 0.063c, ζ = 2 and the driving scale λmax = 30 − 100 kpc gives us a turbulent dissipation of ~9.9 × 10⁻²⁹ − 3.3 × 10⁻²⁸ erg cm-3 s-1. Multiplying this by the mean giant lobe volume (1.4 × 1071 cm3), we obtain a total power dissipation of ~1.4 × 1043 − 4.6 × 1043 erg s-1, which is close to the power of the former jet that we have estimated in Sect. 3.3 based on pressure arguments. Thus this level of turbulence could plausibly have been driven by the pre-existing jet.
4.3.2. Turbulent heating
We assume that the predominant fraction of the energy of the turbulence goes into heating the thermal plasma and a lesser portion into particle (re)acceleration, which is our best guess from our understanding of the physics. For pth = 1.5 × 10⁻¹² dyn cm-2 and B = 0.9 μG (see Sects. 3.2 and 3.3), the plasma β = p/(B2/8π) ~ 47. This may not have a major effect on the properties of the Alfvén waves (see Foote & Kulsrud 1979) but as Howes (2010) shows it might affect the efficacy of particle heating through interactions with the MHD turbulence, with the merit that for high plasma β media it operates more efficiently for hadrons than for leptons.
4.3.3. Consequences for UHECR production in the lobes
Following earlier works (e.g. Lacombe 1977; Eilek 1979; Henriksen et al. 1982; O’Sullivan et al. 2009), we consider a model in which particle acceleration in the giant lobes is provided by a turbulent field of resonant Alfvén waves. In this process, a particle interacts via the cyclotron resonance with waves of wavelength comparable to the particle’s gyroradius: λres ~ rg, with rg = γmc2/ZeB.10 Because the Alfvén waves exist only with wavelengths up to the maximum turbulent scale in the source, there is a maximum particle energy which can resonate with the Alfvénic turbulence. Higher-energy particles, which cannot resonate with any Alfvén wave, are energised much less efficiently, and thus are probably not relevant for UHECR acceleration in the system. Taking λmax = rg = 30 − 100 kpc and B = 0.9 μG, and considering protons, we get γ ~ 2.7 × 10¹⁰ − 8.9 × 10¹⁰, which translates to a proton energy of ~25 − 83 EeV. By way of comparison, for  this translates to γ ~ 1.3 × 10¹⁰ − 4.5 × 10¹⁰ and thus an energy of ~150 − 500 EeV, for
  to γ ~ 1.3 × 10¹⁰ − 4.5 × 10¹⁰ and an energy of ~200 − 666 EeV and for to γ ~ 1.2 × 10¹⁰ − 4.1 × 10¹⁰ and an energy of ~650 − 2165 EeV. Requiring a lower limit of 55 EeV (i.e. the low-energy threshold used for UHECRs by the Pierre Auger Collaboration 2010b) allows lithium and heavier nuclei to “fit” (i.e. resonate with) the turbulent spectrum in the lobes if the driving scale is 30 kpc. A 100 kpc driving scale would also allow UHE protons to “fit”.
In the model we are discussing, the important components of the energy density and pressure in the giant lobes are the thermal protons, the relativistic electrons, and the magnetic field, where those terms have the meanings defined in Sect. 3.3.1, and so the Alfvén speed can be calculated as follows:  (7)with Up,th = np mp c2 ~ 8.1 × 10⁻¹² dyn cm-2, and a pressure stored in thermal protons of pp,th ~ 1.5 × 10⁻¹² dyn cm-2. Supplemented by Ue,rel = 4.3UB ~ 1.4 × 10⁻¹³ dyn cm-2 and pe,rel ~ 4.6 × 10⁻¹⁴ dyn cm-2 (based on Abdo et al. 2010), this results in an Alfvén speed of ~2.4 × 109 cm s-1 (~0.081c).
The resonant acceleration time for a particle of energy γ can be approximated, to within a factor of order unity, as  (8)where UB is the total magnetic energy and Ures is the fraction of this energy resonant with particles at the given γ. This formula can be derived from the full, quasi-linear expression for the acceleration rate (as in Lacombe 1977 or Schlickeiser 1989). Because we are most interested in the highest energies that can resonate with the turbulent spectrum, we estimate the acceleration time solely for particles with rg ~ λmax. If the turbulent spectrum decays with wavelength as described by the Kolmogorov or Kraichnan models, τres increases slowly with particle energy, so τres for the highest energies that “fit” is also a good characterisation of acceleration of lower-energy particles.
Pertinent to  nuclei of energy 55 EeV, B = 0.9 μG and υA = 0.081c, from Eq. (8) and disregarding UB/Ures follows a resonant acceleration time of ~10.9 Myr. For of 55 EeV this yields ~5.5 Myr, and for of this energy we calculate ~4.1 Myr. A locally larger magnetic field, as expected in the giant lobe filaments, would lower these τres results. Alternatively, considering the maximum energy of the above nuclei fitting into the maximum turbulent eddy scale in the range 30 − 100 kpc, the overall τres is between ~14.9 and ~49.7 Myr.
We want to compare the acceleration time for UHECR to the major loss process, namely diffusion out of the radio lobes. Because the lobes are magnetically separated from their surroundings, we consider cross-field diffusion. In a collisionless plasma this is very slow; but particle propagation in electrostatic turbulence can create much faster anomalous diffusion, also called “Bohm diffusion” (e.g. Taylor & McNamara 1971)11. Following Rosso & Pelletier (1993), also Bultinck et al. (2010), we write the diffusion coefficient as DB ≃ rg c/ξ, where different authors find the fudge factor ξ ~ 3 − 30. Thus we estimate the diffusion time as  (9)For numerical estimates we use ξ ~ 10. Taking the mean of the lobe radii, R ~ 90 kpc, and particle gyroradii of 30 and 100 kpc, the foregoing relation gives diffusion times of ~8.8 and ~2.6 Myr respectively.
The requirement for a relatively flat power law, as is generally assumed for UHECRs, and is also measured (Pierre Auger Collaboration 2010a, 2011a), is τacc ≲ τdiff. For a particle gyroradius of rg = 30 kpc this is satisfied as long as the particles do not exceed ~44 EeV (), ~59 EeV ( ), ~89 EeV (), ~118 EeV () and ~384 EeV () in production energy, and both timescales are also amply within the estimated dynamical age (Sect. 3.1) of the lobes. For a gyroradius rg = 100 kpc, the above results shift to ~4 EeV (proton), ~9 EeV (
 ), ~13 EeV (), ~18 EeV (), ~27 EeV (), ~35 EeV () and ~115 EeV () production energy.
Thus, in the context of our model, light elements at UHECR energies fit into the likely lobe turbulence driving scale well. The situation is less clear for nuclei and protons; they would necessitate a driving scale of respectively ≥33 and ≥66 kpc. The diffusion time restricts the maximum energy of nuclei of rg = 33 kpc leaving the lobe to 26.8 EeV and of protons of rg = 66 kpc to 6.7 EeV, hence and protons cannot be accelerated to the PAO band. nuclei do “fit” in our eddy size range but because of the τdiff constraint, they are not likely to be accelerated to the PAO band either. However, were the eddy size 24 kpc, i.e. somewhat below our adopted range, they would make it. Finally, note that we have used an average lobe radius for the above calculations; the perspective is slightly more favourable for the southern giant lobe, but this will not alter the overall outcomes.
4.3.4. Hybrid acceleration mechanism and seeds
Christiansen (1989), Kronberg et al. (2004), Benford & Protheroe (2008) and Stawarz et al. (2013) have proposed in situ magnetic reconnection as a viable mechanism for particle acceleration in galaxies’ lobes. Lazarian & Vishniac (1999) have shown that the magnetic reconnection is determined by the degree of field wandering induced by magnetic turbulence, and we consider the physical conditions in Cen A’s giant lobes (see Sect. 3) appropriate for magnetic reconnection to exist. Based on, e.g., Kowal et al. (2012a) we deem it likely that magnetic reconnection and resonant acceleration co-exist. The resonant acceleration model for the giant lobes in Sect. 4.3.3 is subject to an “injection problem” as it comes down to the lightest nuclei12, i.e., to accelerate those particle species beyond the energy  , seeds are required. Reconnection might provide those seeds (Melrose 1983; Drury 2012), as no minimum energy threshold for thermal particles is required to be accelerated by magnetic reconnection.
The presence of turbulence is expected to increase reconnection rates (Lazarian & Vishniac 1999; Kowal et al. 2009, 2012b). Assuming fast (i.e. independent of resistivity) reconnection, the reconnection velocity υrec is taken of the order of Alfvén speed (Lazarian & Vishniac 1999; Eyink et al. 2011), υrec ~ υA ~ 0.081c. Under ideal circumstances, the fastest possible reconnection acceleration timescale is τrec = rg/η υA (de Gouveia dal Pino & Lazarian 2005), where η is the reconnection efficiency factor. Slower reconnection acceleration timescale occurs at particle’s mean free path λmfp/η υA (i.e. λmfp > rg). If we consider the former case, λrec = rg, and adopting a gyroradius equivalent to the scale13 of a typical reconnection region of order of ~1 pc14, with the proviso that η ~ 1 be used (i.e., a single velocity change expected for every collision with the magnetic inhomogeneities), we obtain τrec ~ 40 yr, which is much faster than we have derived for the resonant acceleration in Sect. 4.3.3. Lazarian & Vishniac (1999) have shown that most of the energy in the reconnection is transferred into turbulent motions, and in fact, the process of the reconnection is an intrinsic part of the MHD turbulent cascade (see also Eyink et al. 2011). Given that the sizes of the reconnection regions are much smaller than the gyroradii of UHECRs in the lobes, reconnection cannot accelerate particles to energies ≥55 EeV.
High-energy particles in the jets driven out by the AGN can also act as seeds, provided the particles do not lose too much energy (e.g. through adiabatic- or synchrotron losses) as they stream through the jet. We know that high-energy leptonic particle acceleration takes place in the jet from observations of high-energy synchrotron radiation. Fermi I acceleration at shocks and acceleration via shear at the jet boundary are themselves mediated by Alfvén waves, hence will have the same injection problem as turbulent Alfvénic acceleration. Magnetic reconnection, in the jet, or in situ in the giant lobes, may be therefore regarded as a tenable alternative. Propitious transport conditions from the jets may exist, as no photodisintegration en route of ≲PeV nuclei should occur at the photon number densities assumed in Cen A’s jets and lobes (Allard et al. 2008 and references therein).
Thus, because of the small dimensions involved, not enough energy will go into seed particles during magnetic reconnection to produce the observed UHECRs, i.e., magnetic reconnection is not useful as the main acceleration process in the lobes. However, being prompt, it is a prime candidate as the process which pre-accelerates particles to energies at which resonant acceleration becomes operational.
5. Summary and conclusions
The main results of this paper can be summarised as follows.
-
1.
We affirm the consistency of various estimates of the current jetpower of ~1 × 1043 erg s-1. The inclusion of special relativistic effects makes relatively little difference to the power of the jet. We have shown that in the inner jet the estimated jet power can be supplied by the observed electron population and an equipartition magnetic field alone, moving at the observed speed of 0.5c. This does not unambiguously prove that the energetics are initially dominated by electrons and magnetic field, but it indicates that it is very likely. We have verified that the jet is not significantly over/underpressured with respect to the surrounding ISM, which allows for the Kelvin-Helmholtz instability to develop at the jet-ISM interface.
-
2.
We have carried out rough modelling of external entrainment from hot gas using the results of Laing & Bridle (2002) for the FR I source 3C 31. We have inferred an entrainment rate of ~3.0 × 10²¹ g s-1, which is a factor of a few below the rate for 3C 31. The fact that the jet might not be embedded in the inner lobe until ~3.7 kpc (projected) supports the credibility of our external entrainment estimates. Our internal entrainment modelling which relies on the generous assumption that the stars are not affected by the jet plasma, resulted in ~6.8 × 10²² g s-1. This is a factor 7 below 3C 31’s internal entrainment rate, on the same assumption. The derived particle content implies imbalance between the internal lobe pressure available from relativistic leptons and magnetic field and the external pressure. To provide the requisite pressure, the material would need to be heated to 2.6 × 10¹¹ K (southern inner lobe) and to 2.0 × 10¹² K (giant lobes).
-
3.
The ratios between the synchrotron ages of the giant lobes of Cen A (~30 Myr; Hardcastle et al. 2009) and our derived sound-crossing timescale (~440 − 645 Myr) and buoyancy age (~560 Myr) of the lobes are dissimilar to most age estimates through these methods in FR II sources, although good contraints on dynamical ages of FR I sources are thus far lacking. We stress that our sound-crossing timescale suffers from lack of a tight constraint on the plasma temperature surrounding the rising giant lobes, and the buoyancy age principally from an insufficient knowledge of the dominance over the lifetime of high internal pressure and/or ram presssure versus buoyancy force, and on the 3D structure of the lobes.
-
4.
We have employed the scaling properties of the gravitational mass and X-ray emitting gas to estimate the thermal pressure and temperature of the giant lobes. Our crude modelling gives us a mean thermal pressure of 1.5 × 10⁻¹² dyn cm-2. This deduction sets the lower limit to the giant lobe temperature as T ~ 1.6 × 10⁸ K. Pressure and dynamical age considerations imply a power of the pre-existing jet (inflating the giant lobes) of ~5 × 1043 erg s-1.
-
5.
If the assumptions about the environment hold and if the Fermi-LAT results are correct (recall that these results only account for electrons), then we require another component in the lobes as well as electrons and magnetic field, and if this is thermal material, then the giant lobes must be dominated by thermal pressure. Even the most conservative limits on the particle density require this material to be hot, and that if it is all supplied by the entrainment it must be outstandingly hot.
-
6.
We have presented arguments for mixed UHECR composition at the source, and suggest that thermal material in the giant lobes may well be enriched in light elements from stellar winds. Large amounts of entrainment, or in general high thermal matter content in the giant lobes, arrests UHECR production via the resonant process in the lobes; in order to accelerate hadrons to the UHE regime, the Alfvén speeds in the giant lobes must be mildly relativistic (a result in agreement with Hardcastle et al. 2009; and O’Sullivan et al. 2009). We have deduced that, to meet the pressure requirements for the lobes, the hadrons must be very hot. The same high temperatures that allow self-consistency between the entrainment calculations and the missing pressure also allow stochastic UHECR acceleration models to work.
-
7.
Our conclusion above is strengthened by a consistency check incorporating the turbulent properties of the giant lobes. The turbulence is sub-Alfvénic, yet the turbulent speed is comfortably close to the Alfvén speed in the lobes, hence the requirement υt ~ υA is satisfied. Our computed resonant acceleration time for the lightest UHE nuclei which “fit” into the turbulent spectrum of 30 − 100 kpc in the giant lobes, and the escape time, are both comfortably within the estimated dynamical age of the lobes. In the frame of our resonance model,
and heavier nuclei fit in the likely driving scale, however the diffusion time restricts the particle species accelerated to ≥55 EeV to and heavier nuclei. -
8.
Magnetic reconnection is not expected to alleviate the hadron heating problem but it will help to lift the hadrons out of the thermal pool and, due to its promptness, will pre-accelerate particles in the giant lobes. We have pictured Cen A as a probable source of at least several of the UHE events detected by the large particle experiments and associate these events with light intermediate nuclei. Even considering the tangible uncertainties in some of the relevant parameter values, Cen A does not make the scene as a genuine producer of UHE protons.
Prospects for constraints on Cen A physics that may be retrieved from surveys with current and future radio, X-ray, gamma-ray and particle detection instruments include the following. Very Long Baseline Array (VLBA) circular polarisation data could provide limits on the relativistic particle population of the parsec-scale jet. Low-frequency radio polarisation observations with the Square Kilometer Array (SKA) may place stronger constraints on the thermal particle content of the jet knots and of the giant lobes. XMM-Newton observations will allow us to assess the distribution of internal energy within the lobes and may give us a more complete picture of localised particle acceleration in the large-scale lobes. Suzaku observations may constrain the plasma temperature surrounding the giant lobes, setting tighter limits on the sound-crossing timescale of the lobes. The Cherenkov Telescope Array (CTA) may provide firm limits on the TeV flux from pion decay in the giant lobes. The detection of VHE neutrinos, by ANTARES, IceCube or the PAO, with an angular resolution better than 1°, could discriminate between neutrinos from Cen A’s jet/core and from its giant lobes, identifying the region of their parent cosmic ray production.
It is unlikely that UB > Ue on these scales: models (e.g. Drenkhahn 2002) show that the conversion of Poynting to mechanically dominated jet occurs relatively close to the nucleus. Moreover, since the minimum energy condition is the equipartition condition, which we assume, it follows that a magnetically dominated jet must carry more energy, and thus if it is magnetically dominated the energy flux can be even higher without invoking protons, in general. So the values we obtain are lower limits if UB > Ue, and the conclusions are unchanged.
A simple way of seeing that the effects of electron-positron annihilation are negligible in a purely leptonic jet on these scales is to consider the characteristic timescale for this process. Although the cross section for annihilation is energy-dependent (e.g. Murphy et al. 2005), the assumption that the cross section is the Thompson cross section and the particle speed the speed of light overestimates the cross section for all but the very lowest energies; thus, taking the timescale τann = n/(dn/dt) = (nσTc)-1 gives a conservative lower limit. If we take the rest-frame energy density for the jet given above, then the number density of relativistic electrons (with n(γ) ∝ γ-2, assuming γmin = 1 and γmax = 108) required is around ne,rel = 3 × 10⁻⁶ cm-3. Then τann ~ 530 Gyr, i.e. much larger than the Hubble time.
A true pressure profile may deviate from the empirical isothermal model, but only markedly beyond large radii; this does not affect our calculations.
We are using “hot thermal plasma with a given kT” as a synonym for “plasma with mean particle kinetic energy of order 3kT/2” and we are not particularly concerned with whether the particle energies have a Maxwell-Boltzmann distribution or not.
The sizes are approximate; the source lacks a clear boundary at 1.4 GHz along most of its large-scale structure and there are uncertainties in the background/noise level. The southern lobe size includes the “gap” region.
Simple treatments of rising bubbles track the position of the lobe centre. However, those treatments consider lobes which are much smaller than their height (or distance from the mass centre), so the bubbles are essentially test particles.
We assume that g is not too variable over the region.
The sound-crossing timescale is not as useful an age estimate since it is hard to justify physically for the large-scale lobes.
This model (see Sect. 4.3.3 for a detailed discussion) requires a field of quasi-isotropic Alfvén waves at the resonant scale, not merely one or two eddies just fitting into the lobe.
Particle acceleration by long-wavelength (λ ≫ rg) magnetosonic turbulence has also been suggested by several authors (e.g. Kulsrud & Ferrari 1971; Achterberg 1981). However, the stronger damping likely for magnetosonic waves (e.g. Eilek 1979; Bicknell & Melrose 1982) makes this process less credible to explain UHECR acceleration in Cen A. We note that the term “second order Fermi acceleration” has been used inconsistently in the literature, sometimes referring to all stochastic MHD processes, other times referring specifically to acceleration by magnetosonic turbulence. We therefore avoid using the term, and just refer to stochastic Alfvénic acceleration.
The term “Bohm diffusion” is also used in a very different context, namely parallel diffusion by Alfvén wave scattering within magnetically connected regions. Although it is not clear that this limit is often reached in MHD turbulence (e.g. Casse et al. 2002), Bohm diffusion is often invoked as the slowest possible diffusion in these situations.
The injection energy depends on mass and charge: protons can be picked up by Alfvén waves at lower energies than electrons, and heavier particles have generally lower resonance thresholds than lighter ones in the (here adequate) weak scattering regime (e.g. Zank et al. 2001). The details of the injection energy versus mass-to-charge ratio depend sensitively on local conditions and will be investigated elsewhere.
Here we refer to the distance between the converging magnetic field lines; not to be confused with the length L of a reconnection region.
This is rather speculative, yet the “small” scale is justified by the requirement that a reconnection region should be ≪ the scale of shock structure (Drury 2012).
Acknowledgments
We thank G. Bicknell, F. Israel, P. Kronberg, I. Feain, O. Pols, R. Perley, E. Körding, H. Falcke, F. Owen, H. Jerjen, A. Corstanje, A. Pe’er, J.-P. Macquart, Ł. Stawarz, J. Kuijpers, C. Cheung, L. Kaper, J. Sanders, L. Drury, H. Henrichs, Gopal-Krishna, A. Levinson, T. Piran, J. Petrovic, and D. Harari for spirited discussions on the subject. J.H.C. is grateful for support from the South-East Physics Network (SEPNet). A.L. acknowledges support from the National Science Foundation (NSF, Grant No. 1212096).
References
- Abdo, A. A., Ackermann, M., Ajello, M., et al. (Fermi-LAT Collaboration) 2010, Science, 328, 725 [NASA ADS] [CrossRef] [PubMed] [Google Scholar]
- Achterberg, A. 1981, A&A, 97, 259 [NASA ADS] [Google Scholar]
- Alexander, P. 1987, MNRAS, 225, 27 [NASA ADS] [CrossRef] [Google Scholar]
- Allard, D., Busca, N. G., Decerprit, G., Olinto, A. V., & Parizot, E. 2008, J. Cosmol. Astro-Particle Phys., 10, 33 [Google Scholar]
- Athey, A., Bregman, J., Bregman, J., Temi, P., & Sauvage, M. 2002, ApJ, 571, 272 [NASA ADS] [CrossRef] [Google Scholar]
- Auld, R., Smith, M. W. L., Bendo, G., et al. 2012, MNRAS, 2227 [Google Scholar]
- Beckmann, V., Jean, P., Lubiński, P., Soldi, S., & Terrier, R. 2011, A&A, 531, A70 [NASA ADS] [CrossRef] [EDP Sciences] [Google Scholar]
- Benford, G., & Protheroe, R. J. 2008, MNRAS, 383, 663 [NASA ADS] [CrossRef] [Google Scholar]
- Bicknell, G. V. 1984, ApJ, 286, 68 [NASA ADS] [CrossRef] [Google Scholar]
- Bicknell, G. V. 1994, ApJ, 422, 542 [NASA ADS] [CrossRef] [Google Scholar]
- Bicknell, G. V. 1995, ApJS, 101, 29 [NASA ADS] [CrossRef] [Google Scholar]
- Bicknell, G. V., & Melrose, D. B. 1982, ApJ, 262, 511 [NASA ADS] [CrossRef] [Google Scholar]
- Biermann, P. L., & de Souza, V. 2012, ApJ, 746, 72 [NASA ADS] [CrossRef] [Google Scholar]
- Biermann, P. L., & Strittmatter, P. A. 1987, ApJ, 322, 643 [NASA ADS] [CrossRef] [Google Scholar]
- Bîrzan, L., Rafferty, D. A., McNamara, B. R., Wise, M. W., & Nulsen, P. E. J. 2004, ApJ, 607, 800 [NASA ADS] [CrossRef] [Google Scholar]
- Bîrzan, L., McNamara, B. R., Nulsen, P. E. J., Carilli, C. L., & Wise, M. W. 2008, ApJ, 686, 859 [NASA ADS] [CrossRef] [Google Scholar]
- Blanton, E. L., Sarazin, C. L., & McNamara, B. R. 2003, ApJ, 585, 227 [NASA ADS] [CrossRef] [Google Scholar]
- Boehringer, H., Voges, W., Fabian, A. C., Edge, A. C., & Neumann, D. M. 1993, MNRAS, 264, L25 [NASA ADS] [CrossRef] [Google Scholar]
- Bowman, M., Leahy, J. P., & Komissarov, S. S. 1996, MNRAS, 279, 899 [NASA ADS] [CrossRef] [Google Scholar]
- Bultinck, E., Mahieu, S., Depla, D., & Bogaerts, A. 2010, J. Phys. D Appl. Phys., 43, C2001 [CrossRef] [Google Scholar]
- Burn, B. J. 1966, MNRAS, 133, 67 [NASA ADS] [CrossRef] [Google Scholar]
- Burns, J. O., Feigelson, E. D., & Schreier, E. J. 1983, ApJ, 273, 128 [NASA ADS] [CrossRef] [Google Scholar]
- Canvin, J. R., & Laing, R. A. 2004, MNRAS, 350, 1342 [NASA ADS] [CrossRef] [Google Scholar]
- Canvin, J. R., Laing, R. A., Bridle, A. H., & Cotton, W. D. 2005, MNRAS, 363, 1223 [NASA ADS] [CrossRef] [Google Scholar]
- Cappellari, M., Neumayer, N., Reunanen, J., et al. 2009, MNRAS, 394, 660 [NASA ADS] [CrossRef] [Google Scholar]
- Carilli, C. L., Perley, R. A., & Harris, D. E. 1994, MNRAS, 270, 173 [NASA ADS] [Google Scholar]
- Casse, F., Lemoine, M., & Pelletier, G. 2002, Phys. Rev. D, 65, 023002 [Google Scholar]
- Cavaliere, A., & Fusco-Femiano, R. 1976, A&A, 49, 137 [NASA ADS] [Google Scholar]
- Cavallo, G. 1978, A&A, 65, 415 [NASA ADS] [Google Scholar]
- Christiansen, W. A. 1989, eds. K. Meisenheimer & H.-J. Roeser (Berlin: Springer Verlag), Lect. Notes Phys., 327, 291 [Google Scholar]
- Churazov, E., Brüggen, M., Kaiser, C. R., Böhringer, H., & Forman, W. 2001, ApJ, 554, 261 [NASA ADS] [CrossRef] [Google Scholar]
- Clarke, D. A., Burns, J. O., & Norman, M. L. 1992, ApJ, 395, 444 [NASA ADS] [CrossRef] [Google Scholar]
- Cristiani, S., Cappellaro, E., Turatto, M., et al. 1992, A&A, 259, 63 [NASA ADS] [Google Scholar]
- Croston, J. H., Hardcastle, M. J., Birkinshaw, M., Worrall, D. M., & Laing, R. A. 2008, MNRAS, 386, 1709 [NASA ADS] [CrossRef] [Google Scholar]
- Croston, J. H., Kraft, R. P., Hardcastle, M. J., et al. 2009, MNRAS, 395, 1999 [NASA ADS] [CrossRef] [Google Scholar]
- de Gouveia dal Pino, E. M., & Lazarian, A. 2005, A&A, 441, 845 [NASA ADS] [CrossRef] [EDP Sciences] [Google Scholar]
- de Plaa, J., Zhuravleva, I., Werner, N., et al. 2012, A&A, 539, A34 [NASA ADS] [CrossRef] [EDP Sciences] [Google Scholar]
- De Young, D. S. 1986, ApJ, 307, 62 [NASA ADS] [CrossRef] [Google Scholar]
- Diehl, S., Li, H., Fryer, C. L., & Rafferty, D. 2008, ApJ, 687, 173 [NASA ADS] [CrossRef] [Google Scholar]
- Drenkhahn, G. 2002, Ph.D. Thesis, University of Amsterdam [Google Scholar]
- Drury, L. O. 2012, MNRAS, 422, 2474 [NASA ADS] [CrossRef] [Google Scholar]
- Dunn, R. J. H., & Fabian, A. C. 2004, MNRAS, 355, 862 [NASA ADS] [CrossRef] [Google Scholar]
- Dunn, R. J. H., Fabian, A. C., & Taylor, G. B. 2005, MNRAS, 364, 1343 [NASA ADS] [CrossRef] [Google Scholar]
- Eilek, J. A. 1979, ApJ, 230, 373 [NASA ADS] [CrossRef] [Google Scholar]
- Eilek, J. A. 1989, AJ, 98, 244 [NASA ADS] [CrossRef] [Google Scholar]
- Eilek, J. A., Arendt, P. A., & Borovsky, J. E. 1994, in The Physics of Active Galaxies, eds. G. V. Bicknell, M. A. Dopita, & P. J. Quinn, ASP Conf. Ser., 54, 363 [Google Scholar]
- Eilek, J. A., Melrose, D. B., & Walker, M. A. 1997, ApJ, 483, 282 [NASA ADS] [CrossRef] [Google Scholar]
- Evans, R. 1986, JBAA, 96, 256 [NASA ADS] [Google Scholar]
- Eyink, G. L., Lazarian, A., & Vishniac, E. T. 2011, ApJ, 743, 51 [NASA ADS] [CrossRef] [Google Scholar]
- Faber, T. E. 1995, Fluid Dynamics for Physicists (Cambridge: Cambridge University Press) [Google Scholar]
- Falcke, H., & Biermann, P. L. 1999, A&A, 342, 49 [NASA ADS] [Google Scholar]
- Fanaroff, B. L., & Riley, J. M. 1974, MNRAS, 167, 31 [NASA ADS] [CrossRef] [Google Scholar]
- Fargion, D. 2008, Phys. Scr., 78, 045901 [Google Scholar]
- Feain, I. J., Ekers, R. D., Murphy, T., et al. 2009, ApJ, 707, 114 [NASA ADS] [CrossRef] [Google Scholar]
- Feain, I. J., Cornwell, T. J., Ekers, R. D., et al. 2011, ApJ, 740, 17 [NASA ADS] [CrossRef] [Google Scholar]
- Feigelson, E. D., Schreier, E. J., Delvaille, J. P., et al. 1981, ApJ, 251, 31 [NASA ADS] [CrossRef] [Google Scholar]
- Feretti, L., Giovannini, G., Klein, U., et al. 1998, A&A, 331, 475 [NASA ADS] [Google Scholar]
- Foote, E. A., & Kulsrud, R. M. 1979, ApJ, 233, 302 [NASA ADS] [CrossRef] [Google Scholar]
- Gil de Paz, A., Boissier, S., Madore, B. F., et al. 2007, ApJS, 173, 185 [NASA ADS] [CrossRef] [Google Scholar]
- Goodger, J. L., Hardcastle, M. J., Croston, J. H., et al. 2010, ApJ, 708, 675 [NASA ADS] [CrossRef] [Google Scholar]
- Gopal-Krishna, Biermann, P. L., de Souza, V., & Wiita, P. J. 2010, ApJ, 720, L155 [NASA ADS] [CrossRef] [Google Scholar]
- Hardcastle, M. J. 2010, MNRAS, 405, 2810 [NASA ADS] [Google Scholar]
- Hardcastle, M. J., & Croston, J. H. 2011, MNRAS, 415, 133 [NASA ADS] [CrossRef] [Google Scholar]
- Hardcastle, M. J., & Worrall, D. M. 2000, MNRAS, 319, 562 [NASA ADS] [CrossRef] [Google Scholar]
- Hardcastle, M. J., Worrall, D. M., & Birkinshaw, M. 1998, MNRAS, 296, 1098 [NASA ADS] [CrossRef] [Google Scholar]
- Hardcastle, M. J., Worrall, D. M., Kraft, R. P., et al. 2003, ApJ, 593, 169 [NASA ADS] [CrossRef] [Google Scholar]
- Hardcastle, M. J., Kraft, R. P., & Worrall, D. M. 2006, MNRAS, 368, L15 [NASA ADS] [CrossRef] [Google Scholar]
- Hardcastle, M. J., Kraft, R. P., Sivakoff, G. R., et al. 2007, ApJ, 670, L81 [NASA ADS] [CrossRef] [Google Scholar]
- Hardcastle, M. J., Cheung, C. C., Feain, I. J., & Stawarz, Ł. 2009, MNRAS, 393, 1041 [NASA ADS] [CrossRef] [Google Scholar]
- Harris, G. L. H., Rejkuba, M., & Harris, W. E. 2010, PASA, 27, 457 [NASA ADS] [CrossRef] [Google Scholar]
- Henriksen, R. N. 1987, ApJ, 314, 33 [NASA ADS] [CrossRef] [Google Scholar]
- Henriksen, R. N., Bridle, A. H., & Chan, K. L. 1982, ApJ, 257, 63 [NASA ADS] [CrossRef] [Google Scholar]
- Howes, G. G. 2010, MNRAS, 409, L104 [NASA ADS] [Google Scholar]
- Isobe, N., Makishima, K., Tashiro, M., & Kaneda, H. 2001, in Particles and Fields in Radio Galaxies Conference, eds. R. A. Laing & K. M. Blundell, ASP Conf. Ser., 250, 394 [Google Scholar]
- Jägers, W. J. 1987, A&AS, 71, 75 [NASA ADS] [Google Scholar]
- Jones, D. L., Tingay, S. J., Murphy, D. W., et al. 1996, ApJ, 466, L63 [NASA ADS] [CrossRef] [Google Scholar]
- Junkes, N., Haynes, R. F., Harnett, J. I., & Jauncey, D. L. 1993, A&A, 269, 29 [NASA ADS] [Google Scholar]
- Kachelrieß, M., Ostapchenko, S., & Tomàs, R. 2009, New J. Phys., 11, 065017 [NASA ADS] [CrossRef] [Google Scholar]
- Kaiser, C. R., Schoenmakers, A. P., & Röttgering, H. J. A. 2000, MNRAS, 315, 381 [NASA ADS] [CrossRef] [Google Scholar]
- Karachentsev, I. D., Tully, R. B., Dolphin, A., et al. 2007, AJ, 133, 504 [NASA ADS] [CrossRef] [Google Scholar]
- Karakas, A. I. 2010, MNRAS, 403, 1413 [NASA ADS] [CrossRef] [Google Scholar]
- Katsuta, J., Tanaka, Y. T., Stawarz, Ł., et al. 2013, A&A, 550, A66 [NASA ADS] [CrossRef] [EDP Sciences] [Google Scholar]
- Komissarov, S. S. 1994, MNRAS, 269, 394 [NASA ADS] [CrossRef] [Google Scholar]
- Konar, C., Saikia, D. J., Jamrozy, M., & Machalski, J. 2006, MNRAS, 372, 693 [NASA ADS] [CrossRef] [Google Scholar]
- Kowal, G., Lazarian, A., Vishniac, E. T., & Otmianowska-Mazur, K. 2009, ApJ, 700, 63 [NASA ADS] [CrossRef] [Google Scholar]
- Kowal, G., de Gouveia Dal Pino, E. M., & Lazarian, A. 2012a, Phys. Rev. Lett., 108, 241102 [NASA ADS] [CrossRef] [Google Scholar]
- Kowal, G., Lazarian, A., Vishniac, E. T., & Otmianowska-Mazur, K. 2012b, Nonlinear Processes in Geophysics, 19, 297 [Google Scholar]
- Kraft, R. P., Vázquez, S. E., Forman, W. R., et al. 2003, ApJ, 592, 129 [NASA ADS] [CrossRef] [Google Scholar]
- Kraft, R. P., Forman, W. R., Hardcastle, M. J., et al. 2009, ApJ, 698, 2036 [NASA ADS] [CrossRef] [Google Scholar]
- Kronberg, P. P., Colgate, S. A., Li, H., & Dufton, Q. W. 2004, ApJ, 604, L77 [NASA ADS] [CrossRef] [Google Scholar]
- Kulsrud, R. M., & Ferrari, A. 1971, Ap&SS, 12, 302 [NASA ADS] [CrossRef] [Google Scholar]
- Lacombe, C. 1977, A&A, 54, 1 [NASA ADS] [Google Scholar]
- Laing, R. A., & Bridle, A. H. 2002, MNRAS, 336, 1161 [NASA ADS] [CrossRef] [Google Scholar]
- Laing, R. A., Canvin, J. R., Bridle, A. H., & Hardcastle, M. J. 2006, MNRAS, 372, 510 [NASA ADS] [CrossRef] [Google Scholar]
- Lazarian, A., & Vishniac, E. T. 1999, ApJ, 517, 700 [NASA ADS] [CrossRef] [Google Scholar]
- Liu, R.-Y., Wang, X.-Y., Wang, W., & Taylor, A. M. 2012, ApJ, 755, 139 [Google Scholar]
- Mac Low, M.-M., Klessen, R. S., Burkert, A., & Smith, M. D. 1998, Phys. Rev. Lett., 80, 2754 [NASA ADS] [CrossRef] [Google Scholar]
- Mannheim, K. 1995, Astropart. Phys., 3, 295 [NASA ADS] [CrossRef] [Google Scholar]
- McNamara, B. R., & Nulsen, P. E. J. 2007, ARA&A, 45, 117 [NASA ADS] [CrossRef] [MathSciNet] [Google Scholar]
- Melrose, D. B. 1983, Sol. Phys., 89, 149 [NASA ADS] [CrossRef] [Google Scholar]
- Morganti, R., Killeen, N. E. B., Ekers, R. D., & Oosterloo, T. A. 1999, MNRAS, 307, 750 [NASA ADS] [CrossRef] [Google Scholar]
- Moskalenko, I. V., Stawarz, Ł., Porter, T. A., & Cheung, C. C. 2009, ApJ, 693, 1261 [NASA ADS] [CrossRef] [Google Scholar]
- Müller, C., Kadler, M., Ojha, R., et al. 2011, A&A, 530, L11 [NASA ADS] [CrossRef] [EDP Sciences] [Google Scholar]
- Murphy, R. J., Share, G. H., Skibo, J. G., & Kozlovsky, B. 2005, ApJS, 161, 495 [NASA ADS] [CrossRef] [Google Scholar]
- Nulsen, P. E. J., David, L. P., McNamara, B. R., et al. 2002, ApJ, 568, 163 [NASA ADS] [CrossRef] [Google Scholar]
- O’Sullivan, S. 2011, in AIP Conf. Ser. 1367, eds. H. Sagawa, Y. Kawasaki, T. Sako, M. Takeda, & Y. Tsunesada, 76 [Google Scholar]
- O’Sullivan, S., Reville, B., & Taylor, A. M. 2009, MNRAS, 400, 248 [NASA ADS] [CrossRef] [Google Scholar]
- O’Sullivan, E., Worrall, D. M., Birkinshaw, M., et al. 2011, MNRAS, 416, 2916 [NASA ADS] [CrossRef] [Google Scholar]
- O’Sullivan, S. P., Feain, I. J., McClure-Griffiths, N. M., et al. 2013, ApJ, 764, 162 [NASA ADS] [CrossRef] [Google Scholar]
- Pacholczyk, A. G., & Scott, J. S. 1976, ApJ, 203, 313 [NASA ADS] [CrossRef] [Google Scholar]
- Pe’er, A., & Loeb, A. 2012, J. Cosmol. Astropart. Phys., 3, 7 [NASA ADS] [CrossRef] [Google Scholar]
- Perucho, M., & Martí, J. M. 2007, MNRAS, 382, 526 [NASA ADS] [CrossRef] [Google Scholar]
- Pierre Auger Collaboration 2010a, Phys. Lett. B, 685, 239 [Google Scholar]
- Pierre Auger Collaboration 2010b, Astropart. Phys., 34, 314 [NASA ADS] [CrossRef] [MathSciNet] [Google Scholar]
- Pierre Auger Collaboration 2011a [arXiv:1107.4809] [Google Scholar]
- Pierre Auger Collaboration 2011b [arXiv:1107.4804] [Google Scholar]
- Pierre Auger Collaboration 2013, J. Cosmol. Astropart. Phys., 2, 26 [NASA ADS] [Google Scholar]
- Protheroe, R. J. 2010, Proc. Workshop, Fermi meets Jansky: AGN in Radio and Gamma-Rays [Google Scholar]
- Rejkuba, M., Harris, W. E., Greggio, L., & Harris, G. L. H. 2011, A&A, 526, A123 [NASA ADS] [CrossRef] [EDP Sciences] [Google Scholar]
- Rosso, F., & Pelletier, G. 1993, A&A, 270, 416 [NASA ADS] [Google Scholar]
- Sanders, J. S., & Fabian, A. C. 2007, MNRAS, 381, 1381 [NASA ADS] [CrossRef] [Google Scholar]
- Sanderson, A. J. R., Ponman, T. J., Finoguenov, A., Lloyd-Davies, E. J., & Markevitch, M. 2003, MNRAS, 340, 989 [NASA ADS] [CrossRef] [Google Scholar]
- Saxton, C. J., Sutherland, R. S., & Bicknell, G. V. 2001, ApJ, 563, 103 [NASA ADS] [CrossRef] [Google Scholar]
- Schlickeiser, R. 1989, ApJ, 336, 243 [NASA ADS] [CrossRef] [Google Scholar]
- Stawarz, Ł., Tanaka, Y. T., Madejski, G., et al. 2013, ApJ, 766, 48 [NASA ADS] [CrossRef] [Google Scholar]
- Stecker, F. W., Done, C., Salamon, M. H., & Sommers, P. 1991, Phys. Rev. Lett., 66, 2697 [NASA ADS] [CrossRef] [PubMed] [Google Scholar]
- Stefan, I. I., Carilli, C. L., Green, D. A., et al. 2013, MNRAS, 432, 1285 [NASA ADS] [CrossRef] [Google Scholar]
- Stickel, M., van der Hulst, J. M., van Gorkom, J. H., Schiminovich, D., & Carilli, C. L. 2004, A&A, 415, 95 [NASA ADS] [CrossRef] [EDP Sciences] [Google Scholar]
- Struve, C., Oosterloo, T. A., Morganti, R., & Saripalli, L. 2010, A&A, 515, A67 [NASA ADS] [CrossRef] [EDP Sciences] [Google Scholar]
- Takeuchi, Y., Kataoka, J., Stawarz, Ł., et al. 2012, ApJ, 749, 66 [NASA ADS] [CrossRef] [Google Scholar]
- Tashiro, M., Kaneda, H., Makishima, K., et al. 1998, ApJ, 499, 713 [NASA ADS] [CrossRef] [Google Scholar]
- Taylor, J. B., & McNamara, B. 1971, Phys. Fluids, 14, 1492 [NASA ADS] [CrossRef] [Google Scholar]
- Tingay, S. J., Jauncey, D. L., Reynolds, J. E., et al. 1998, AJ, 115, 960 [NASA ADS] [CrossRef] [Google Scholar]
- Tully, R. B. 1988, Nearby galaxies catalog (CUP) [Google Scholar]
- Vacca, W. D., Garmany, C. D., & Shull, J. M. 1996, ApJ, 460, 914 [NASA ADS] [CrossRef] [Google Scholar]
- Wang, Y., Kaiser, C. R., Laing, R., et al. 2009, MNRAS, 397, 1113 [NASA ADS] [CrossRef] [Google Scholar]
- Willis, A. G., Wilson, A. S., & Strom, R. G. 1978, A&A, 66, L1 [NASA ADS] [Google Scholar]
- Yang, R.-Z., Sahakyan, N., de Ona Wilhelmi, E., Aharonian, F., & Rieger, F. 2012, A&A, 542, A19 [NASA ADS] [CrossRef] [EDP Sciences] [Google Scholar]
- Zank, G. P., Rice, W. K. M., le Roux, J. A., & Matthaeus, W. H. 2001, ApJ, 556, 494 [NASA ADS] [CrossRef] [Google Scholar]
All Figures
|
Fig. 1 Combined Australia Telescope Compact Array (ATCA) and Parkes 1.4 GHz radio continuum image at 60′′ × 40′′ angular resolution of the large-scale structure of Centaurus A (adapted from Feain et al. 2011), showing the giant lobes and the vertex and vortex filaments. The jets, inner lobes and the northern middle lobe are located in the saturated region centred on the nucleus. The elongated feature in the north-west part of the southern giant lobe, aligned approximately with the inner lobes, is the background FR I radio galaxy PKS B1318–434 of the Centaurus cluster at ~45 Mpc. |
| In the text | |
|
Fig. 2 Total jet power estimated with the formula in the text with the apparent jet speed fixed, as a function of the angle of the jet to the plane of the sky, using assumptions given by Hardcastle & Croston (2011). |
| In the text | |
Current usage metrics show cumulative count of Article Views (full-text article views including HTML views, PDF and ePub downloads, according to the available data) and Abstracts Views on Vision4Press platform.
Data correspond to usage on the plateform after 2015. The current usage metrics is available 48-96 hours after online publication and is updated daily on week days.
Initial download of the metrics may take a while.