Fig. 11
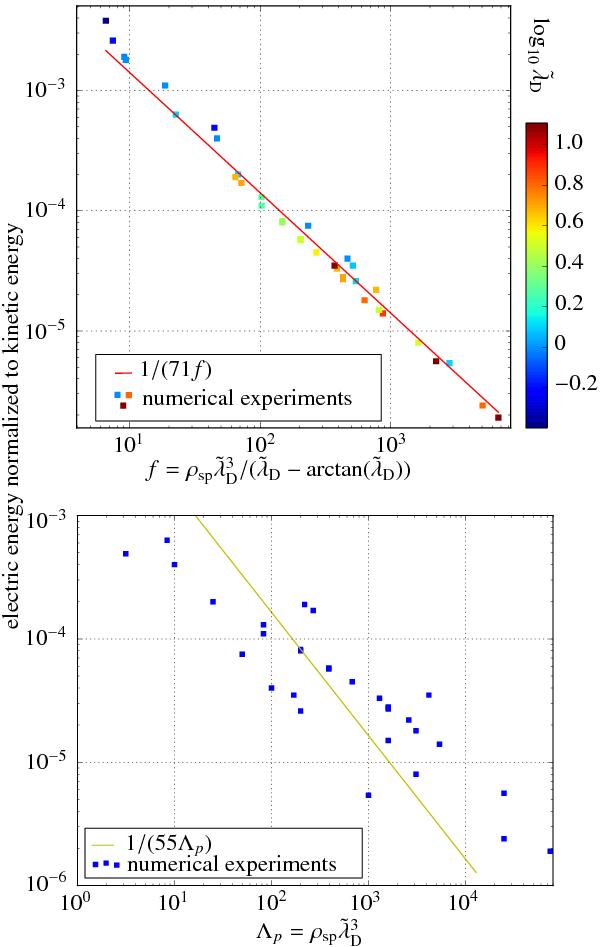
Top: field energy levels as a function of 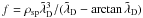 . The colorbar is
  . Blue points at low f have an under-resolved Debye length that could explain the mismatch with 1/f. Bottom: field energy levels versus
  . We clearly see the mismatch between 1/Λp and the results, even if the trend is correct. The large scatter is a hint that Λ is not a relevant parameter to describe field fluctuations. Top and bottom: each point is the result from a simulation. The field energy levels are measured as the energy in the x electric field,
  (with α from Eq. (A.6)), divided by the kinetic energy of the superparticles, ∑ sp(γsp − 1).
Current usage metrics show cumulative count of Article Views (full-text article views including HTML views, PDF and ePub downloads, according to the available data) and Abstracts Views on Vision4Press platform.
Data correspond to usage on the plateform after 2015. The current usage metrics is available 48-96 hours after online publication and is updated daily on week days.
Initial download of the metrics may take a while.