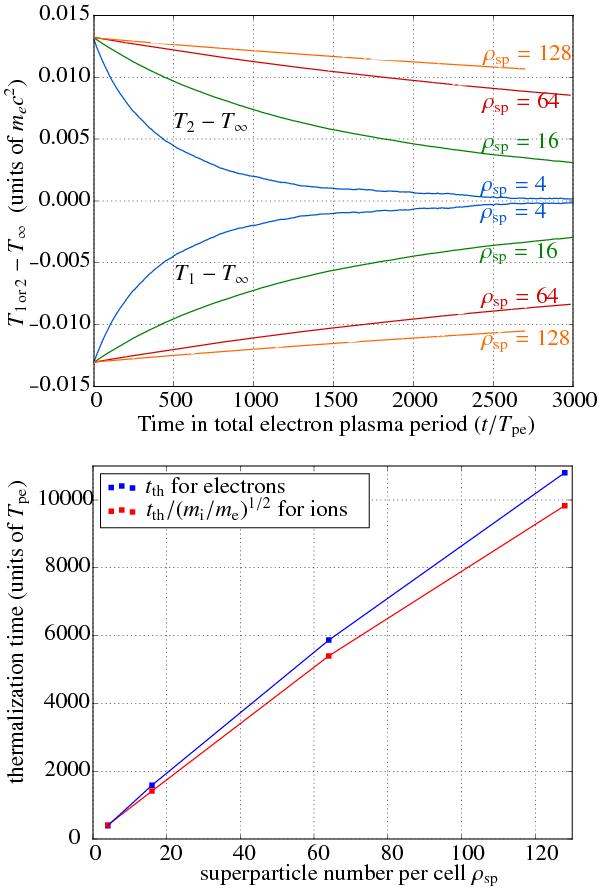
Fig. 10

Top: electron temperatures for the hot (2) and cold (1) plasmas, from four simulations with different ρsp. The curves for ion temperatures are similar, except for an overall time dilatation by a factor ~ (mi/me)1/2 = 5. In this figure we use T∞(t) = (T1(t) + T2(t))/2. Except for ρsp = 4 where there is significant numerical heating, T∞(t) is constant in time. Bottom: half-thermalization time for ions and electrons, versus number of superparticles per cell. For ions, we have plotted tth/(mi/me)1/2. The times reported are measured as the initial slope of the temperature curves in a log-lin plot, and thus correspond to tth/2. We see the scaling tth ∝ ρsp.
Current usage metrics show cumulative count of Article Views (full-text article views including HTML views, PDF and ePub downloads, according to the available data) and Abstracts Views on Vision4Press platform.
Data correspond to usage on the plateform after 2015. The current usage metrics is available 48-96 hours after online publication and is updated daily on week days.
Initial download of the metrics may take a while.


