Fig. A.15
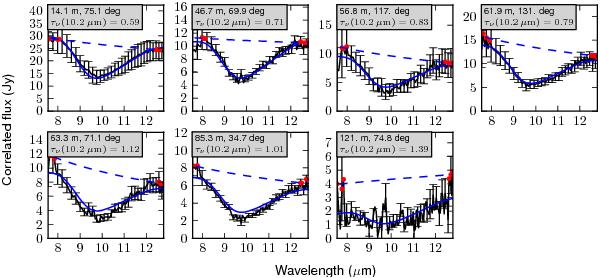
Measured correlated flux spectra (solid black line and error bars) for R Mon, in order of increasing projected baseline. The caption shows the projected baseline and position angle of each observation. The dashed blue line shows a continuum fit to the red points, and the solid blue line shows the best fit to the absorption spectrum (see Sect. 4.3).
Current usage metrics show cumulative count of Article Views (full-text article views including HTML views, PDF and ePub downloads, according to the available data) and Abstracts Views on Vision4Press platform.
Data correspond to usage on the plateform after 2015. The current usage metrics is available 48-96 hours after online publication and is updated daily on week days.
Initial download of the metrics may take a while.