Free Access
Fig. 10
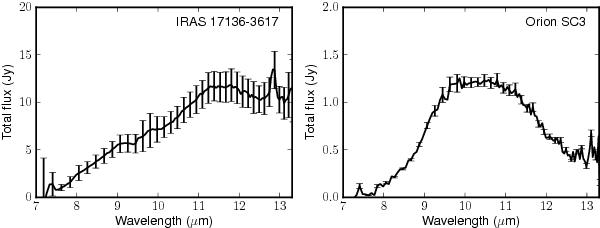
Total spectrum of IRAS 17136-3617 (left) and Orion SC3 (right) measured with the 8.2 m UT telescopes on 2006-05-18 and 2005-02-26, respectively. The error bars represent the uncertainty in the absolute flux calibration.
Current usage metrics show cumulative count of Article Views (full-text article views including HTML views, PDF and ePub downloads, according to the available data) and Abstracts Views on Vision4Press platform.
Data correspond to usage on the plateform after 2015. The current usage metrics is available 48-96 hours after online publication and is updated daily on week days.
Initial download of the metrics may take a while.