Fig. 8
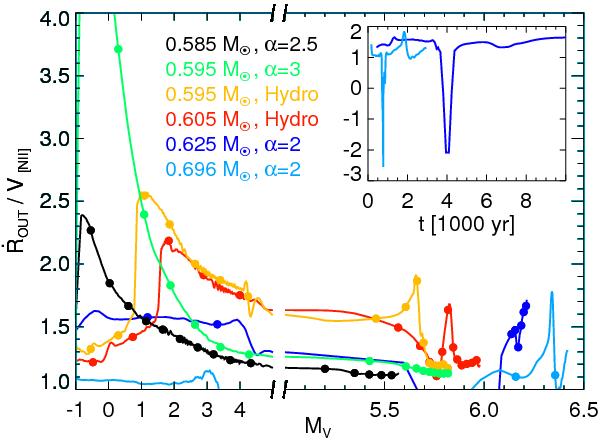
Correction factor FN II
(=  )
as it follows from various radiation-hydrodynamic model sequences, plotted over
stellar absolute magnitude, MV. Evolution
is always from left to right. The abscissa is broken at
MV = 5, and the faint part is
expanded to provide more clarity. As compared to Fig. 5, three additional sequences were included. The dots along the velocity
sequences correspond to time steps of 103 years each and are meant only to
illustrate the pace of evolution, not absolute post-AGB ages. The 0.595
M⊙ sequence with α = 3 reaches very
early a maximum FN II(=
Ṙout/V[N ii])
of 7.5. The inset illustrates the time evolution of
FN II during the nebular recombination phase (0.625
and 0.696 M⊙ only) when
FN II becomes smaller than unity and even negative for
a very brief time span. Note that for the earliest evolutionary stages,
MV ≤ −1, our predictions can be
uncertain because of the extremely small sizes of the model nebulae.
)
as it follows from various radiation-hydrodynamic model sequences, plotted over
stellar absolute magnitude, MV. Evolution
is always from left to right. The abscissa is broken at
MV = 5, and the faint part is
expanded to provide more clarity. As compared to Fig. 5, three additional sequences were included. The dots along the velocity
sequences correspond to time steps of 103 years each and are meant only to
illustrate the pace of evolution, not absolute post-AGB ages. The 0.595
M⊙ sequence with α = 3 reaches very
early a maximum FN II(=
Ṙout/V[N ii])
of 7.5. The inset illustrates the time evolution of
FN II during the nebular recombination phase (0.625
and 0.696 M⊙ only) when
FN II becomes smaller than unity and even negative for
a very brief time span. Note that for the earliest evolutionary stages,
MV ≤ −1, our predictions can be
uncertain because of the extremely small sizes of the model nebulae.
Current usage metrics show cumulative count of Article Views (full-text article views including HTML views, PDF and ePub downloads, according to the available data) and Abstracts Views on Vision4Press platform.
Data correspond to usage on the plateform after 2015. The current usage metrics is available 48-96 hours after online publication and is updated daily on week days.
Initial download of the metrics may take a while.