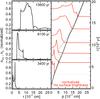
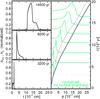
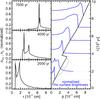
Fig. 3
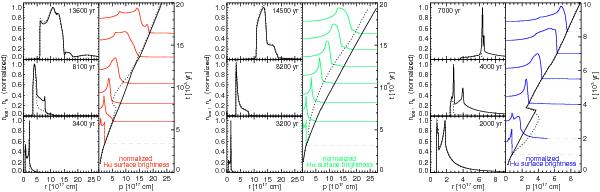
Snapshots of model density structures and Hα intensity distributions for 3 hydrodynamical sequences: 0.605 M⊙ “hydro”, (left), 0.595 M⊙ “α = 3”, (middle), and 0.625 M⊙ “α = 2” (right) at selected times (right ordinate). Left part of the panels: normalised total ion (solid) and electron densities (dotted) over radius r at the indicated times, for comparisons. Right part of the panels: evolution of Rout (solid) and R10 (dotted) with time t. At a number of times, defined by the cut of the intensity line with the right ordinate, the (normalised) Hα intensity profiles are plotted over the impact parameter p. Note that the extremely sharp density peaks seen in the right panel at times of 4000 and 7000 years have no correspondence in the intensity profiles because the gas is not ionised.
Current usage metrics show cumulative count of Article Views (full-text article views including HTML views, PDF and ePub downloads, according to the available data) and Abstracts Views on Vision4Press platform.
Data correspond to usage on the plateform after 2015. The current usage metrics is available 48-96 hours after online publication and is updated daily on week days.
Initial download of the metrics may take a while.