Fig. 2
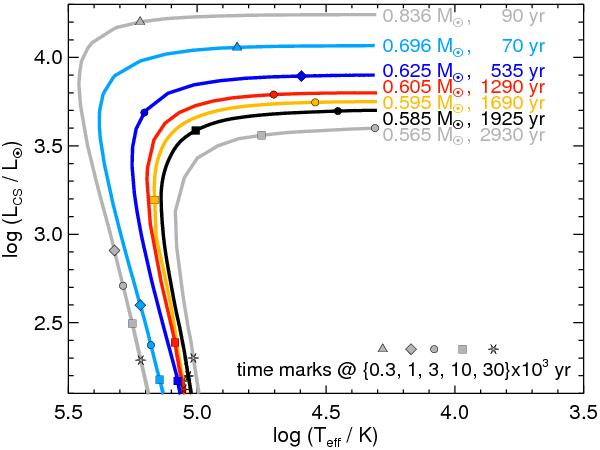
Hertzsprung-Russell diagram of post-AGB stellar models used in nebular simulations. They are from Schönberner (1983) and Schönberner & Blöcker (1993) and interpolated (0.595 and 0.585 M⊙). The progress of stellar evolution along each track is indicated by time marks at 0.3 × 10³, 1 × 10³, 3 × 10³, 10 × 103, and 30 × 103 years. The “transition time” from the tip of the AGB to Teff = 20 000 K is also given for each model sequence and is fully considered for the positioning of the time marks. The colour coding of the individual post-AGB tracks is kept the same throughout the whole paper.
Current usage metrics show cumulative count of Article Views (full-text article views including HTML views, PDF and ePub downloads, according to the available data) and Abstracts Views on Vision4Press platform.
Data correspond to usage on the plateform after 2015. The current usage metrics is available 48-96 hours after online publication and is updated daily on week days.
Initial download of the metrics may take a while.