Fig. 4
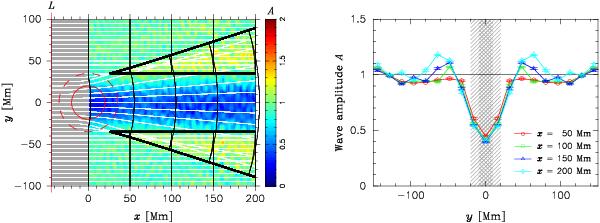
Wave amplitude perturbations for p4 caused by the sunspot. Left: map of observed amplitudes A (color scale). The white lines are 2D rays traced through a sunspot model, such that the wave speed is enhanced by 10% inside the circle and transitions smoothly to the background value (53.28 km s-1) at the dashed circle. The wavefronts are given by the black lines. The thick black lines indicate the boundaries of the caustics where rays intersect and wavefronts fold. Right: observed amplitudes A as a function of y at fixed distances from the sunspot ranging from x = 50 to 200 Mm. Notice the amplitude enhancements around y ~ ± 60 Mm.
Current usage metrics show cumulative count of Article Views (full-text article views including HTML views, PDF and ePub downloads, according to the available data) and Abstracts Views on Vision4Press platform.
Data correspond to usage on the plateform after 2015. The current usage metrics is available 48-96 hours after online publication and is updated daily on week days.
Initial download of the metrics may take a while.