Fig. 3
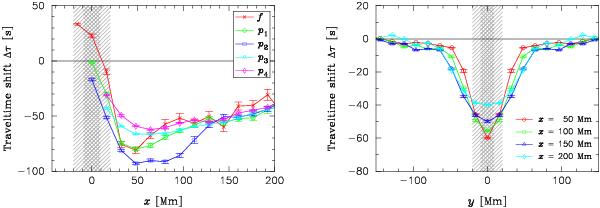
Observed travel-time shifts, Δτ. The left panel shows the travel-time shifts along y = 0 for modes f through p4, which heal as the distance from the sunspot, x, increases. The right panel shows the travel-time shifts of p4 modes as functions of y at four different values of x. Notice the spread in the transverse direction as x increases. The hatched and cross-hatched area indicate the locations of the penumbra and umbra, respectively.The data is averaged over patches of size 16 × 16 Mm2 to filter out spatial scales that are dominated by noise. Error bars give the standard deviation of the mean.
Current usage metrics show cumulative count of Article Views (full-text article views including HTML views, PDF and ePub downloads, according to the available data) and Abstracts Views on Vision4Press platform.
Data correspond to usage on the plateform after 2015. The current usage metrics is available 48-96 hours after online publication and is updated daily on week days.
Initial download of the metrics may take a while.