Fig. 2
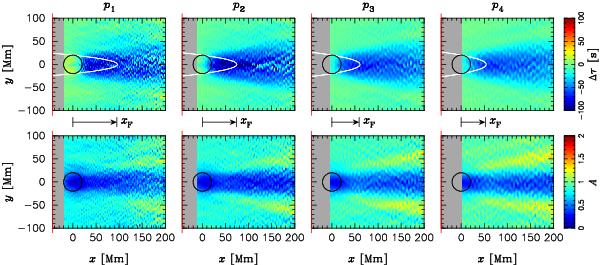
Spatial maps of travel-time shifts Δτ(x,y) (top) and wave packet amplitudes A(x,y) (bottom) with respect to the quiet Sun. From left to right are results for wave packets p1, p2, p3, and p4. Waves propagate from L (red lines) in the + x direction. The black circles denote the outer boundary of the penumbra of the sunspot. The parabolic curves (white lines with equation (y/R)2 + x/(xF + λ/8) = 1) depict the boundaries of the first plane-wave Fresnel zones with focus at (x,y) = (xF,0), chosen such that the sunspot fills the width of the Fresnel zone. The focus position xF depends on radial order and is taken from Table 1. We do not display the results in the near fields (gray regions where distances from L are less than 3λ).
Current usage metrics show cumulative count of Article Views (full-text article views including HTML views, PDF and ePub downloads, according to the available data) and Abstracts Views on Vision4Press platform.
Data correspond to usage on the plateform after 2015. The current usage metrics is available 48-96 hours after online publication and is updated daily on week days.
Initial download of the metrics may take a while.