Fig. 7
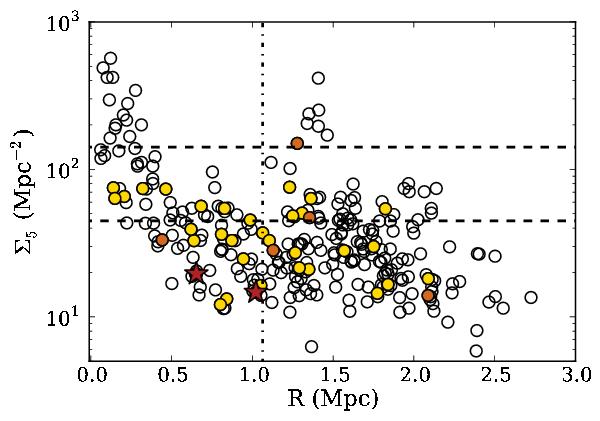
Local density as a function of the cluster-centric radius. Open circles represent cluster members not detected in the FIR, yellow and orange filled circles represent MIPS-only and Herschel-detected SF galaxies, respectively. The vertical dash-dotted line at 1.05 Mpc shows the virial radius. The horizontal dashed lines at log Σ = 1.65 and 2.15 indicate the limits between the low-, intermediate-, and high-density environments. The red stars are the AGN candidates.
Current usage metrics show cumulative count of Article Views (full-text article views including HTML views, PDF and ePub downloads, according to the available data) and Abstracts Views on Vision4Press platform.
Data correspond to usage on the plateform after 2015. The current usage metrics is available 48-96 hours after online publication and is updated daily on week days.
Initial download of the metrics may take a while.