Fig. 5
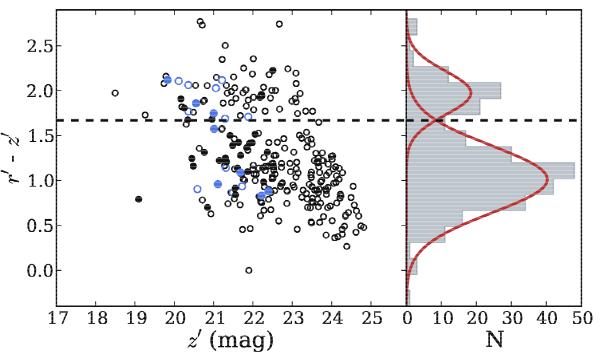
Colour–magnitude diagram r′ − z′ vs. z′ (right) and the r′ − z′ colour distribution (left) of the cluster members. Open circles show the cluster members sample and filled circles are the FIR-emitter cluster sample. Blue circles are spectroscopic sources, and black circles are photometric cluster candidates. The red curves show the best-fit Gaussian functions and the dot-dashed black line indicates the boundary between optical red and blue galaxies.
Current usage metrics show cumulative count of Article Views (full-text article views including HTML views, PDF and ePub downloads, according to the available data) and Abstracts Views on Vision4Press platform.
Data correspond to usage on the plateform after 2015. The current usage metrics is available 48-96 hours after online publication and is updated daily on week days.
Initial download of the metrics may take a while.