Fig. 4
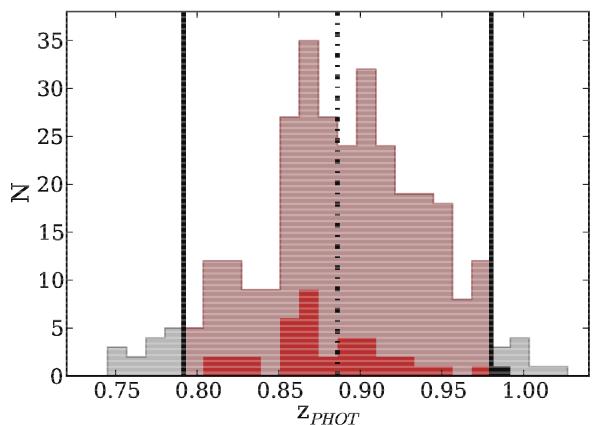
Histogram of the redshifts obtained for the initial candidate sample (black) and for the final sample of 292 robust cluster candidates, 21 spectroscopic and 271 photometric (red). The filled histogram represents the FIR-emitter sample. The dot-dashed line at 0.886 indicates the locus of the photometric redshift of the cluster, and the solid lines shows the final photometric range we have considered.
Current usage metrics show cumulative count of Article Views (full-text article views including HTML views, PDF and ePub downloads, according to the available data) and Abstracts Views on Vision4Press platform.
Data correspond to usage on the plateform after 2015. The current usage metrics is available 48-96 hours after online publication and is updated daily on week days.
Initial download of the metrics may take a while.