Fig. 3
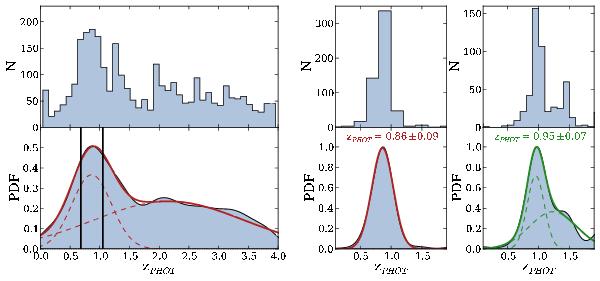
Photometric redshift histograms (top) and their probability density distributions (bottom) for one Monte Carlo simulation (left), one cluster galaxy fitted with a simple Gaussian (centre), and an other cluster galaxy fitted with a double Gaussian (right). Solid-coloured curves show the best fit obtained in each case, and dashed coloured curves show the individual Gaussian function for the double Gaussian fits. Black vertical lines indicate the locus of the photometric cluster range zPHOT = [0.70, 1.07].
Current usage metrics show cumulative count of Article Views (full-text article views including HTML views, PDF and ePub downloads, according to the available data) and Abstracts Views on Vision4Press platform.
Data correspond to usage on the plateform after 2015. The current usage metrics is available 48-96 hours after online publication and is updated daily on week days.
Initial download of the metrics may take a while.