Fig. 2
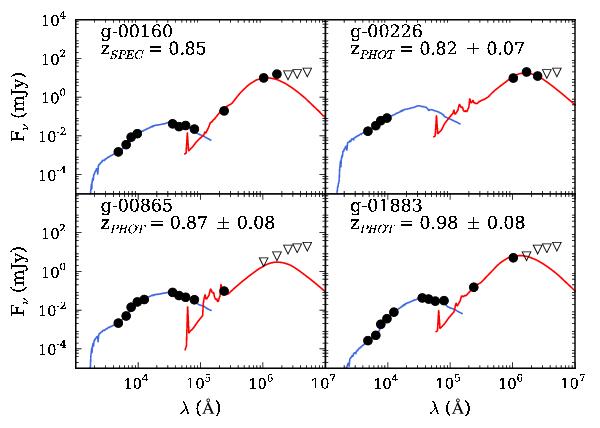
Example of SED fitting for a representative sample of the FIR cluster galaxies: one spectroscopic cluster member, one Herschel-only detected, one MIPS-only detected and one detected in both MIPS and Herschel. Black filled circles show the observed photometry of each source, open triangles show upper limits. Blue curves represent the BC03 template that best fit the stellar part of the spectrum from the optical to IRAC 8 μm. Red curves are the CE01 templates that best fit the fluxes from IRAC 8 μm to SPIRE 500 μm.
Current usage metrics show cumulative count of Article Views (full-text article views including HTML views, PDF and ePub downloads, according to the available data) and Abstracts Views on Vision4Press platform.
Data correspond to usage on the plateform after 2015. The current usage metrics is available 48-96 hours after online publication and is updated daily on week days.
Initial download of the metrics may take a while.