Fig. 14
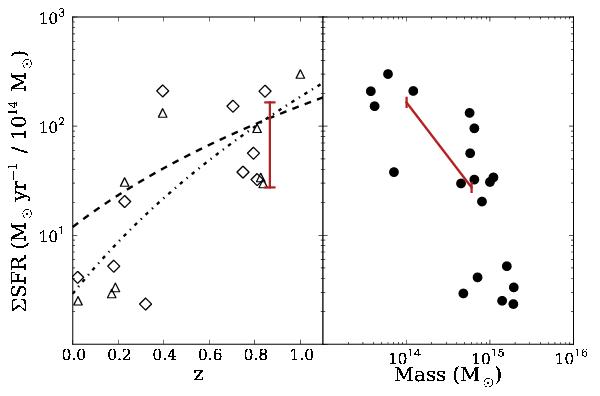
Total cluster SFR per unit cluster mass as a function of redshift (left) and as a function of cluster mass (right). Open diamonds and triangles show the integrated total SFR estimated with Hα and IR data, respectively, compiled by Koyama et al. (2010). The red line indicates the cluster mass and, consequently, the ΣSFR/MCl range of RX J1257. The dashed line shows the best fit to ΣSFR/MCl ~ (1 + z)α, and the dot-dashed line shows the best fit setting the power index to α = 6.
Current usage metrics show cumulative count of Article Views (full-text article views including HTML views, PDF and ePub downloads, according to the available data) and Abstracts Views on Vision4Press platform.
Data correspond to usage on the plateform after 2015. The current usage metrics is available 48-96 hours after online publication and is updated daily on week days.
Initial download of the metrics may take a while.