Fig. 11
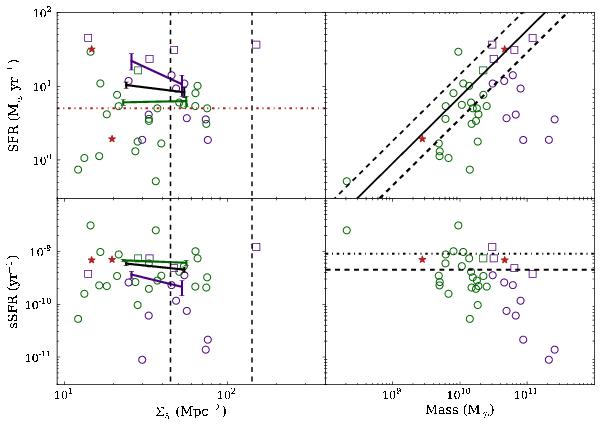
SFR and sSFR of the FIR emitters as a function of the local density and the stellar mass. Open circles and open squares represent MIPS-only and Herschel-detected cluster members, respectively. Violet symbols show high-mass (M⋆ ≥ 2.5 × 10¹⁰) galaxies, green symbols show low-mass (M⋆ < 2.5 × 10¹⁰) galaxies. In the left panels, we indicate the median values of the low-mass, the high-mass, and the full sample in each environment with green, violet, and black lines, respectively. The error bars are computed as the standard deviation of the median values distribution. The horizontal dot-dashed red line indicates the completeness limit of our FIR-emitter sample. The vertical dashed lines at log Σ5 = 1.65 and 2.15 separate the low-, intermediate-, and high-density environments as defined in KO08. The average number of FIR-undetected galaxies is 190, 79, and 24 in the low-, intermediate-, and high-density bins, respectively. In the upper right panel, the solid line indicates the SFR-M⋆ correlation from Elbaz et al. (2007), and the dashed lines show the 68% dispersion. In the lower right panel, the dashed line corresponds to the relation of Elbaz et al. (2011) for the main-sequence galaxies at the redshift of the cluster, and the dashed-dotted line indicates the lower limit for the starburst region. The red stars in each panel show the AGN candidates.
Current usage metrics show cumulative count of Article Views (full-text article views including HTML views, PDF and ePub downloads, according to the available data) and Abstracts Views on Vision4Press platform.
Data correspond to usage on the plateform after 2015. The current usage metrics is available 48-96 hours after online publication and is updated daily on week days.
Initial download of the metrics may take a while.