Fig. 7
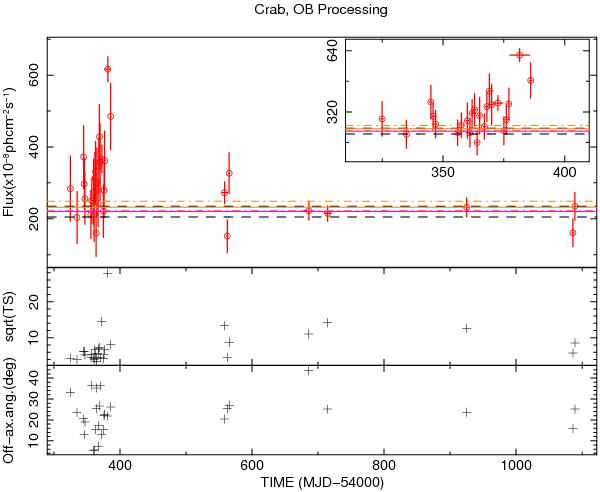
Crab E > 100 MeV light curve (upper panel), the  (middle panel), and the off-axis angle (in degrees) as a function of time (lower panel) for detections with an off-axis angle lower than 50° and exposures greater than 9 × 106 cm2 s. The 1AGL flux values and the 1σ error levels are shown as magenta line and black dashed lines, while the weighted mean value of all OB fluxes and its 1σ error levels are shown in orange. The 2007 Crab flare episode (MJD = 54 381.5) is its most significant detection at a flux of 62.0 ± 7.0 × 10⁻⁷ ph cm-2 s-1. Large error bars at MJD ≤ 54 420 are mostly obtained with 1−3 day exposures.
Current usage metrics show cumulative count of Article Views (full-text article views including HTML views, PDF and ePub downloads, according to the available data) and Abstracts Views on Vision4Press platform.
Data correspond to usage on the plateform after 2015. The current usage metrics is available 48-96 hours after online publication and is updated daily on week days.
Initial download of the metrics may take a while.