Fig. 4
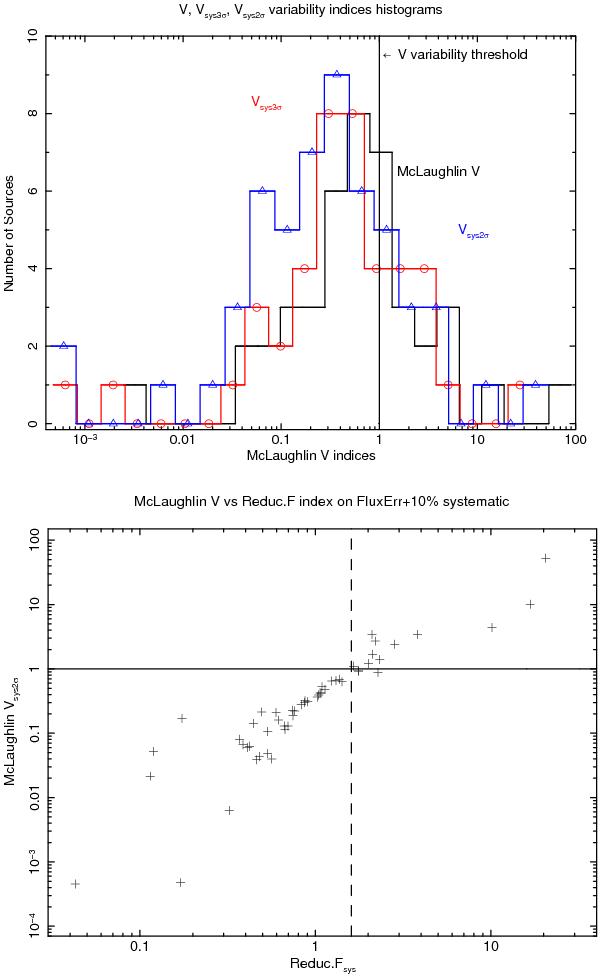
Upper panel: histograms of the V (black unmarked line), Vsys2σ (red line with circles), and Vsys3σ (blue lines with triangles) parameters; lower panel: plot of Vsys2σ vs. the Reduc.Fsys. The vertical line in the upper plot is the threshold above which a source is variable (V ≥ 1) according to the V parameters. The horizontal line in the lower plot has the same meaning, while the vertical dashed line is the approximated extrapolation of a threshold for source variability for the Reduc.Fsys parameter, taking into account the correlation of both parameters.
Current usage metrics show cumulative count of Article Views (full-text article views including HTML views, PDF and ePub downloads, according to the available data) and Abstracts Views on Vision4Press platform.
Data correspond to usage on the plateform after 2015. The current usage metrics is available 48-96 hours after online publication and is updated daily on week days.
Initial download of the metrics may take a while.