Fig. 3
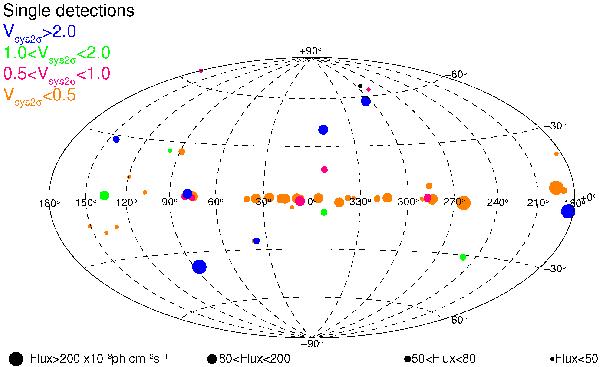
Aitoff projection of the 54 distinct source positions detected on all pointed observations data (symbol colors indicate the variability parameter Vsys2σ of the 53 sources for which we define with blue the highest and with orange the lowest value. 1AGL J1238+0406 has a single detection and so is marked in black. Marker sizes are proportional to flux).
Current usage metrics show cumulative count of Article Views (full-text article views including HTML views, PDF and ePub downloads, according to the available data) and Abstracts Views on Vision4Press platform.
Data correspond to usage on the plateform after 2015. The current usage metrics is available 48-96 hours after online publication and is updated daily on week days.
Initial download of the metrics may take a while.