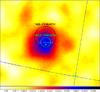
Fig. 2
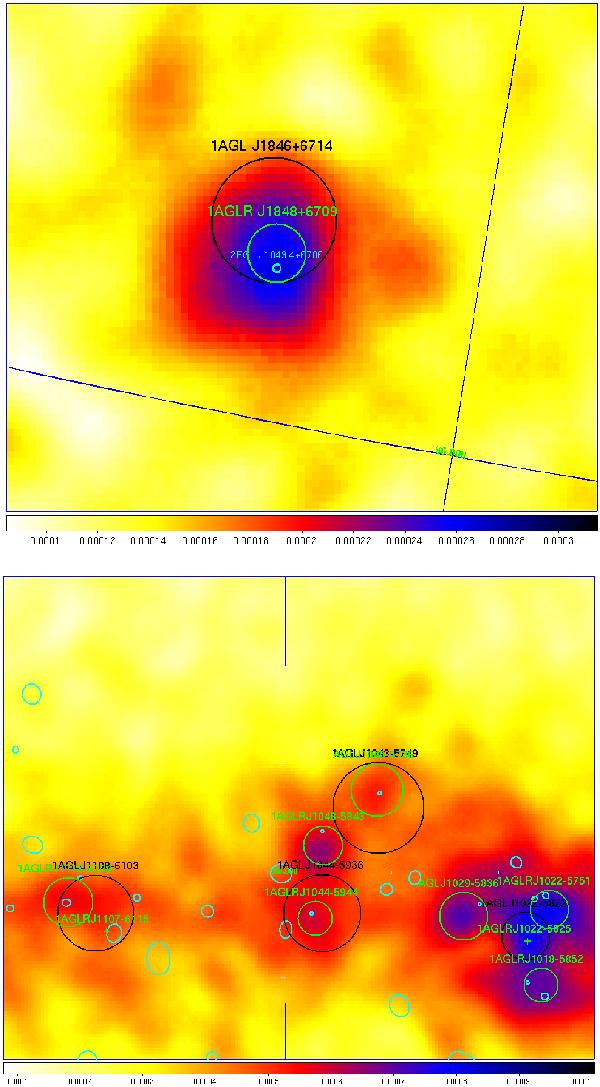
Intensity maps of two 1AGL field refinements. In the first panel a simple case is shown, the high-latitude source 1AGL J1846+6714 repositioned to 1AGLR J1848+6709. The new smaller error circle is indicated in green inside the 1AGL circle, while the 2FGL J1849.4+6706 error ellipse is plotted in cyan. In the second panel a complex case is shown, the Carina region. New sources and new positions for 1AGL sources are indicated with a green circle, except for two sources for which no 95% c.l. contour has been obtained; their positions are indicated with crosses. The 1AGL error circles are indicated in black, the 2FGL error ellipses in cyan.
Current usage metrics show cumulative count of Article Views (full-text article views including HTML views, PDF and ePub downloads, according to the available data) and Abstracts Views on Vision4Press platform.
Data correspond to usage on the plateform after 2015. The current usage metrics is available 48-96 hours after online publication and is updated daily on week days.
Initial download of the metrics may take a while.