Fig. 12
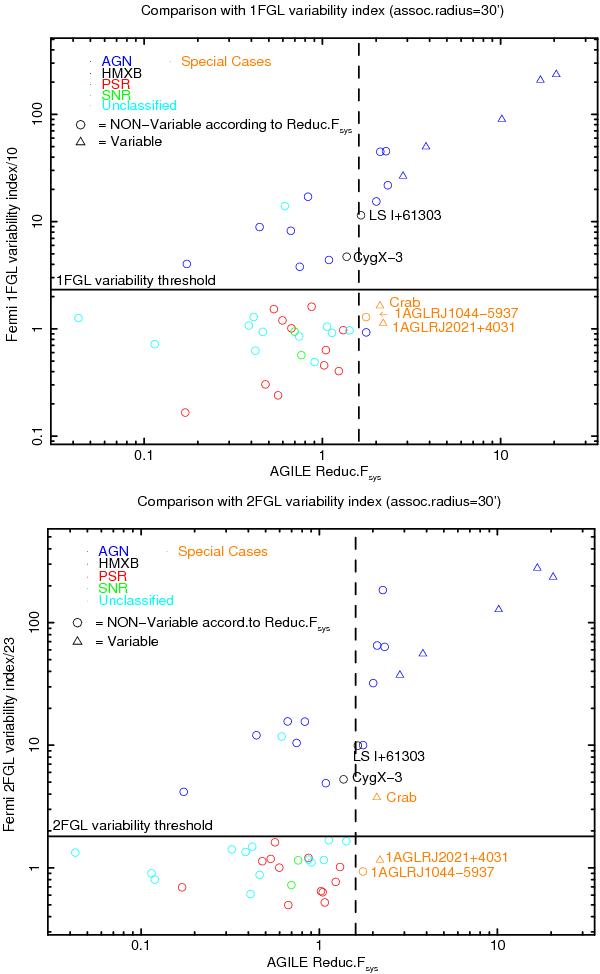
Upper plot: Fermi 1FGL variability index divided by 10 vs. Reduc.Fsys for all detections associated with the 1FGL sources with a cross-matching with radius 30′, where colours correspond to source classes, blue for AGNs, black for HMXBs, red for PSRs, green for SNRs, light-blue for the unclassified ones, and orange for the three Special Cases Crab nebula + pulsar, 1AGLR J2021+4030 (γ Cygni region) and 1AGLR J1044-5944 (Eta Carinae). Markers correspond to AGILE variability type according to Reduc.Fsys, i.e. circles for non-variable and triangles for variable. The lower plot is obtained with association to the 2FGL catalogue with the same radius and shows the 2FGL index divided by 23. The black horizontal lines are the 1FGL and 2FGL variability thresholds, 2.32 and 1.81, while the dashed vertical lines correspond to the approximately extrapolated threshold (1.6) for the AGILE variability Reduc.Fsys parameter obtained from the correlation with the Vsys2σ parameter.
Current usage metrics show cumulative count of Article Views (full-text article views including HTML views, PDF and ePub downloads, according to the available data) and Abstracts Views on Vision4Press platform.
Data correspond to usage on the plateform after 2015. The current usage metrics is available 48-96 hours after online publication and is updated daily on week days.
Initial download of the metrics may take a while.