Fig. 11
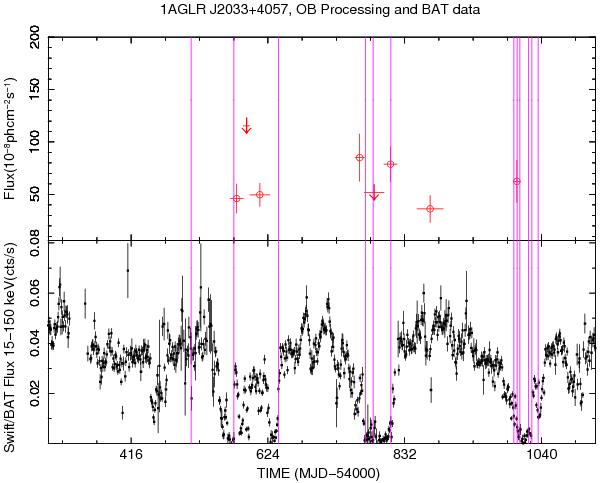
1AGLR J2033+4057/Cyg X-3 E > 100 MeV light curve (upper panel) compared with the Swift/BAT 15 < E < 150 keV daily light curve. The plot shows six detections with  . The 1−2 days γ-ray flare times described in Tavani et al. (2009c), Bulgarelli et al. (2012a), and Piano et al. (2012) are marked with vertical magenta lines. For some lines there is no corresponding UL when they have
  .
.
Current usage metrics show cumulative count of Article Views (full-text article views including HTML views, PDF and ePub downloads, according to the available data) and Abstracts Views on Vision4Press platform.
Data correspond to usage on the plateform after 2015. The current usage metrics is available 48-96 hours after online publication and is updated daily on week days.
Initial download of the metrics may take a while.